
Best Mutual Funds to Invest in for Long Term
Updated on January 15, 2024
Written by Manish Kothari
CEO Zfunds

Share

Best Mutual Funds for Long Term Investment
With the potential for larger profits, long-term mutual funds are intended for individuals with a longer investment horizon. Long-term investments aid in the generation of wealth for investors. However, these profits come with inherent risks, particularly connected to shifts in interest rates, which could affect the fund's Net Asset Value (NAV).
Maintaining a close eye on interest rates and the state of the economy is necessary when investing in long-term mutual funds. The Equity Mutual Fund is the finest investing choice in the long run. We've included a list of the best mutual funds for long term in India to assist you in better comprehending this.
Best Long Term Mutual Funds to Invest in 2024
The following are best mutual funds to invest in for long term:
| Parag Parikh Flexi Cap Fund | Flexi Cap Fund | 5.5 | 28.7 | 23.4 | 18.1 | 16.4 |
| Kotak Emerging Equity Fund | Mid Cap Fund | 5.4 | 38.2 | 23 | 14.4 | 16.1 |
| PGIM India Midcap Opp Fund | Mid Cap Fund | 10.1 | 48 | 34.5 | 18.2 | 15.8 |
| Canara Rob Bluechip Equity Fund | Large Cap Fund | 1.9 | 23.4 | 16.9 | 14.3 | 13 |
| Canara Rob Flexi Cap Fund | Flexi Cap Fund | 2.3 | 25.6 | 16.9 | 13.9 | 12.4 |
| ICICI Pru Value Discovery Fund | Value Fund | 13.8 | 33.5 | 20.2 | 13.4 | 12.3 |
| Mirae Asset Hybrid Equity Fund | Aggressive Hybrid Fund | 3.4 | 20.6 | 13.5 | 12.2 | - |
What is a Long-Term Investment?
Investments regarded as long-term often yield better returns after five years or more. You can invest in aggressive market instruments because these have bigger returns and greater market risk. While a short term mutual fund helps you reach your financial objectives faster and at a reduced risk, long-term investing options offer returns and have a bigger risk tolerance. The following categories apply to these investing options:
a. Stocks
b. Equity Mutual Funds
Equity Mutual Funds for Long-term Investing
The following are the categories of Equity mutual funds:
- Large-cap Funds: A large-cap fund invests at least 80% of its assets in large-cap firms, defined as the top 100 corporations in terms of market capitalization.
- Mid Cap Funds: Mid-cap funds allocate a minimum of 65% of their assets to mid-cap businesses.
- Small Cap Fund: These funds allocate a minimum of 65% of their assets to small-cap businesses.
- Multi-Cap Funds: These funds always allocate at least 25% of their total assets to investing in large, mid-sized, and small-cap equities.
Best Approach to Long Term Mutual Fund Investments

#1.)Top 5 Large Cap Funds for Long-term Investment
The large-cap funds allocate capital to buy large-cap equities. These funds make investments in companies that have the potential to generate strong profits and consistent growth year after year, which eventually provides stability. Investing in large-cap funds may be preferred by investors with a moderate to high tolerance for risk. Here is an overview of the best large cap mutual fund:
| Fund | NAV | Net Assets (Cr) | Min SIP Investment | 1 YR (%) | 3 YR (%) | 5 YR (%) |
| Nippon India Large Cap Fund | ₹73.448 | ₹18,072 | 100 | 33.8 | 23.7 | 17 |
| IDBI India Top 100 Equity Fund | ₹44.16 | ₹655 | 500 | 15.4 | 21.9 | 12.6 |
| HDFC Top 100 Fund | ₹981.127 | ₹27,687 | 300 | 30.6 | 21.3 | 16.1 |
| ICICI Prudential Bluechip Fund | ₹88.93 | ₹44,425 | 100 | 28.3 | 19.3 | 17.1 |
| TATA Large Cap Fund | ₹426.709 | ₹1,699 | 150 | 25.2 | 18 | 15.6 |
#2. Top 5 MidCap Funds for Long-term Investment

Mid-cap schemes make investments in medium-sized company equities or mid-cap stocks. The best midcap mutual fund are those with the highest ratings and highest-yielding returns. Have a look:
| Fund | AUM (Cr.) | Min SIP Investment | 3 MO (%) | 6 MO (%) | 1 YR (%) | 3 YR (%) | 5 YR (%) |
| Motilal Oswal Midcap Fund | ₹7410.69 | 500 | 18.44 | 29.09 | 49.98 | 36.54 | 27.00 |
| Mirae Asset Midcap Fund | ₹13815.10 | 500 | 17.51 | 25.50 | 40.11 | 27.65 | - |
| Quant Mid Cap Fund | ₹4222.4 | 1000 | 17.35 | 30.70 | 40.26 | 35.16 | 29.65 |
| Edelweiss Mid Cap Fund | ₹4623.64 | 100 | 14.65 | 27.51 | 45.68 | 28.70 | 25.60 |
| Nippon India Growth Fund | ₹23494.65 | 100 | 14.32 | 30.38 | 52.22 | 30.68 | 25.79 |
#3. Top 5 Small Cap Funds for Long-Term Investment
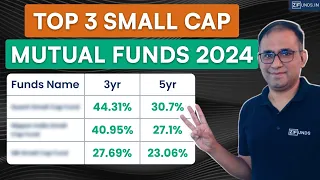
Small-cap funds make investments in small- and startup-company stocks. Small-cap businesses could suffer greatly if they are unable to offer remarkable returns during a volatile market. As a result, only those with a strong risk appetite should consider investing in these funds. Here are some of the best small cap mutual funds:
| AMC | 1 Year Return | 3 Years Return | 5 Years Return |
| Quant Small Cap Fund | 33.21% | 46.17% | 30.37% |
| Nippon India small cap fund | 33% | 42.51% | 24.29% |
| SBI Small Cap Fund | 18.64% | 32.52% | 21.57% |
| Axis Small Cap Fund | 21.72% | 33.49% | 25.32% |
| HDFC Small Cap Fund | 35.48% | 35.86% | 19.80% |
#4). Top 5 Multi Cap Funds for Long-term Investment

Multi-cap funds invest in large, mid, and small-cap segments of the market. Usually, they allocate 40–60% of their investments to large-cap stocks, 10–40% to mid-cap equities, and roughly 10% to small-cap stocks. Here are the best multicap mutual fund in 2024:
| Fund Name | 3-Year Return (%) | 5-Year Return (%) |
|---|---|---|
| Nippon India Multi Cap Fund | 38.8 | 17.4 |
| Quant Active Fund | 34.5 | 23.2 |
| Kotak India Growth Fund | 32.3 | 20.3 |
| Mahindra Manulife Multi Cap Fund | 31.4 | 19.0 |
| ICICI Pru Multicap Fund | 29.0 | 14.2 |
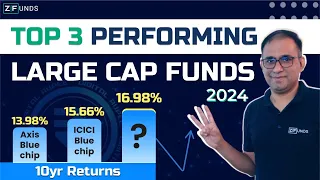
#5.) Top 10 Mutual Funds for 10-Year
The following are the best mutual funds for 10 years that can help you improve your finances:
| Fund | 10 Year Return (%) | Investment( 1000/Month) | Total Return |
| Mirae Asset Large Cap Fund | 17.61% | ₹1,20,000 | ₹3,15,635 |
| ICICI Prudential Bluechip Fund | 14.76% | ₹1,20,000 | ₹2,32,339 |
| HDFC Small Cap Fund | 14.76% | ₹1,20,000 | ₹2,32,339 |
| DSP Small Cap Fund | 20.75% | ₹1,20,000 | ₹3,82,363 |
| ICICI Prudential MidCap | 15.91% | ₹1,20,000 | ₹2,62,091 |
| Aditya Birla Sun Life Government Securities Fund | 9.07% | ₹1,20,000 | ₹1,95,750 |
| ICICI Prudential Gilt Fund | 7.89% | ₹1,20,000 | ₹1,83,023 |
| HDFC Dynamic Debt Fund | 7.15% | ₹1,20,000 | ₹1,75,561 |
| HDFC Income Fund | 7.15% | ₹1,20,000 | ₹1,75,56 |
| Aditya Birla Sun Life Banking and PSU Debt Fund | 8.87% | ₹1,20,000 | ₹1,85,738 |
#6.) Top 20 Mutual Funds for 20 Years
These are India's best mutual funds for 20 years that you can invest in in 2024. With a varied portfolio of stocks, bonds, and other financial instruments, reasonable expense ratios, and solid track records, each of these mutual funds has its own special features and advantages:
| Fund | AUM (Rs Crore) | Expense Ratio (%) | 20-Year SIP Return (%)* |
| ICICI Prudential Technology Fund | 8,993.09 | 2.11 | 18.52 |
| ICICI Prudential FMCG Fund | 1,156.49 | 2.57 | 17.76 |
| Sundaram Midcap Fund | 7,048.79 | 1.87 | 17.29 |
| Nippon India Growth Fund | 13,409.61 | 1.83 | 17.04 |
| Quant Active Fund | 3,531.89 | 2.63 | 16.41 |
| Nippon India Banking & Financial Services Fund | 3,826.52 | 2.05 | 16.21 |
| HDFC Flexi Cap Fund | 31,672.65 | 1.77 | 16.08 |
| ABSL Digital India Fund | 3,338.13 | 2.11 | 16.01 |
| Franklin India Prima Fund | 7,359.95 | 1.90 | 15.89 |
| Franklin India Flexi Cap Fund | 9,989.33 | 1.86 | 15.50 |
| Quant Large And Mid-Cap Fund Direct-Growth | 1,486 | 0.75 | 19.49 |
| Quant Tax Plan- Direct-Growth Fund | 1,296 | 0.76 | 19.49 |
| Axis Blue-chip Fund Direct Plan-Growth | 30,733 | 0.66 | 14.92 |
| Mirae Asset Emerging Blue-chip Fund Direct-Growth | 28,104 | 0.64 | 22.89 |
| Canara Robeco Emerging Equities Fund | 18,845 | 0.57 | 20.81 |
| ICICI Prudential Gilt Fund Direct-Growth Plan | 4,142.88 | 0.56 | 9.47 |
| Nippon India Small Cap Fund | 41,019 | 1.82 | 21.9 |
| ICICI Prudential Smallcap Fund | 6,608 | 2.04 | 13.3 |
| Kotak Small Cap Fund | 13,377 | 1.48 | 17.8 |
| Aditya Birla Sun Life Digital India Fund | 4,590.39 | 2.08 | 12.1 |
#7). Best Banking & PSU Funds - Best Mutual Funds to Invest in for Long Term
Banking & PSU Funds are debt mutual funds that invest at least 65% of their assets in the securities & bonds issued by Banks, Public sector companies & financial institutions.
| Fund | 3-Year Returns | 5-Year Returns | YTM |
| Aditya Birla Sun Life Banking & PSU Debt Fund | 8.09% | 8.96% | 5.97 |
| Franklin India Banking & PSU | 8.44% | 8.60% | 6 |
1. Aditya Birla Sun Life Banking & PSU Debt Fund
ABSL Banking & PSU Debt is an excellent choice for investment in the Banking & PSU Debt Fund category. The fund has an exposure of 100% of its assets in AAA-rated debt securities.The fund has been managed by Mr.Kaustubh Gupta since September 2009 & Mr. Maneesh Dangi since April 2017.
Worth of Investments
- A Lump Sum Investment of Rs.1 Lacs for 5 Years would have been grown to Rs.1.54 Lacs.
- SIP Investments of Rs.10,000 every month for 5 Years would have grown to Rs.7.52 Lacs.
2. Franklin India Banking & PSU is also a good option in the Banking & PSU category. The fund has an exposure of near about 97% of its assets in AAA rate high-quality papers.The fund has been managed by Mr.Sachin Padwal-Desai since April 2014 & Mr. Umesh Sharma since April 2014.
Worth of Investments
- A Lump Sum Investment of Rs.1 Lacs for 5 Years would have grown to Rs.1.51 Lacs.
- SIP Investments of Rs.10,000 every month for 5 Years would have grown to Rs.7.53 Lacs.
#8.) For Moderate Investors- Moderate-Risk Portfolio
Moderate Investors are those investors who have a moderate risk profile and are willing to take some risks by investing a moderate portion of the portfolio in equity securities.These investors would be willing to accept the turbulent times in the markets for the probability of earning good returns over the long horizon. Along with that, their portfolio allocation in debt securities or mutual funds would ensure a low volatility in the portfolio.
These investors come somewhere between the aggressive & conservative investors in terms of risk-return expectations. In other words, moderate investors are willing to take higher risks than conservative investors but lower than aggressive investors.
A Moderate risk mutual fund portfolio would look like this
| Funds | Allocation % |
| Equity Mutual Funds | 50% |
| Debt Mutual Funds | 50% |
Moderate Investors would have two options for their portfolio selection.
Also Read: ICICI Prudential Freedom SIP Plan
How to Invest in Mutual Funds for the long term?
You have two options for investing in mutual funds: online and offline.
a. Offline Method
To process an offline MF using the offline method, you must establish a connection with the branch relationship manager. Listed below are the documents required for proof of identity.
- Assess the profile of your investments: Every person's goals and needs can be met by a mutual fund plan. Investment options include debt, hybrid, and equity mutual funds. Select the kind according to your time horizon, investment objective, and risk tolerance.
- Application Form for Mutual Funds
- MF KYC acknowledgment (MF KYC Form, PAN card Copy, Address Proof, and Passport Size Photo are required if KYC is not completed).
- One self-account cheque for investment purposes
b. Online Method
You can invest in mutual funds online by contacting banks or other financial organizations. Many banks allow consumers to invest in Mutual Funds online through their mobile app or Internet Banking.
Note: Sub-heading coming as a copy
Final Note for Investors
The portfolio allocation may vary among investors from the mentioned broad categories as each individual has its own needs & financial requirements, therefore investments should be planned accordingly. Also, the portfolio needs rebalancing or requires reconstitution sometimes, it would be better to connect with your financial advisor to cater to your portfolio review & rebalancing needs after a periodic interval.
Investors should also note that the above-mentioned top mutual funds do not guarantee any successful returns on Investments as markets are highly uncertain.
More Information:
- Bharat Bond ETF - Meaning, Benefits, Price, Interest Rate, Review
- Shariah Compliant Mutual Funds - Types, Who can Invest, Minimum Investment
- Equity Balanced Funds - Benefits, Taxation, How to Choose
- How to Invest in Mutual Funds?
- Index Funds - Meaning, Purpose, How to Work, Risk, Returns
- Section 80D - Deductions, Tax Benefits, Claim Amount, Example
- Deduction under Section 80TTA
- PM Vaya Vandana Yojana (PMVVY): Scheme Eligibility, Interest Rate, Process to Apply
- Kisan Vikas Patra (KVP) Scheme: Benefits, Types, Interest Rates, Eligibility, Calculation