
AIF · Equity · CAT III - LONG ONLY - SMALL CAP & MID CAP
Alchemy - Leaders of Tomorrow
Fund size₹935 Cr
Alpha (3Y)4.99%
3Y return17.97%
Fund age8 yrs 6 mo
From the research desk
Spotting market leaders before the market does.
Alchemy Leaders of Tomorrow is Alchemy Capital's Mid/Small Cap AIF strategy, built by a team with over two decades of experience in Indian equities. It invests in businesses with the potential to emerge as market leaders, companies operating in large, evolving opportunity sets, backed by scalable models, durable competitive advantages and management teams with strong governance and capital discipline.
The aim is to invest ahead of market leadership, not follow it, through a broad company universe screened for long term structural themes. Ideas are generated through company interactions, industry networks, channel checks, and macro research, then filtered through detailed fundamental analysis and analysis before entering the portfolio.
Future facing, not backward looking
Seeks to identify and invest in businesses before they become tomorrow's leaders, rather than owning names that have already led the last cycle.
A differentiated opportunity set
Extends beyond traditional listed equity investing by identifying emerging businesses benefiting from structural shifts, participating across multiple stages of a company's evolution.
Built for the next leg of Mid and Small Cap growth
Positioned to benefit from a broadening opportunity set in mid and small caps, focused on businesses with sustained earnings growth and reasonable valuations.
Fund Managers
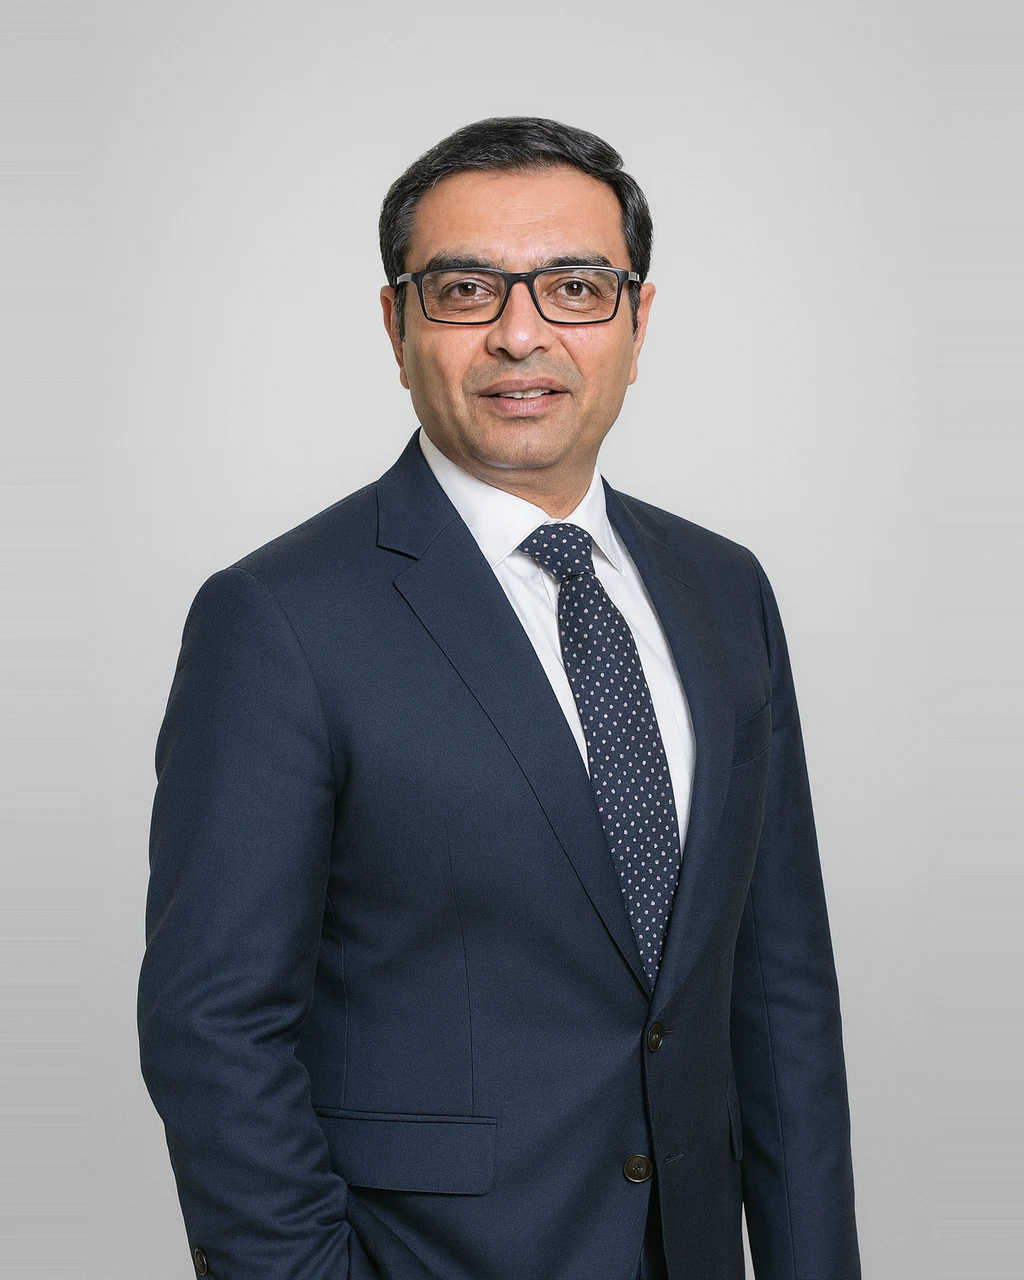
Mr. Hiren Ved
Director And CIO, Alchemy
Hiren Ved, an equity market veteran, serves as the Whole-Time Director, and CIO at Alchemy Capital Management where he has been leading the firm’s Asset Management business. With over 30 years of experience in the Indian equities market, Hiren has developed a sustainable long-term investment philosophy based on fundamental research. He is known for his deep sector knowledge, bottom-up research skills and stock picking abilities. Hiren manages and advises funds over USD 931 million (as on June 30, 2023) across domestic PMS and offshore institutional mandates for Alchemy Capital. He holds a graduate degree in Accounting from Mumbai University and a post-graduation in Management & Cost Accounting from The Institute of Cost Accountants of India.
Managing AUM₹8,237 Cr

Himani Shah
Co-fund Manager, Alchemy
–
Managing AUM₹475 Cr
Growth of₹Cr
Alchemy Leaders of Tomorrow
Returns: How it has done
| Scheme / Benchmark | YTD | 1Y | 2Y | 3Y | 5Y | Since inception |
|---|---|---|---|---|---|---|
| Alchemy Leaders of Tomorrow | 15.57% | 11.33% | 2.72% | 17.97% | 17.37% | 15.42% |
| Nifty 500 | −1.07% | 1.95% | −0.66% | 10.65% | 11.01% | 11.06% |
| Excess over benchmark | 16.64% | 9.38% | 3.38% | 7.32% | 6.36% | 4.36% |
Returns up to one year are absolute; two years and above are annualised (CAGR). YTD is calendar-year-to-date. As on 31 Jul 2026.
Risk : What you take on to earn the return
Volatility
19.99%
Benchmark approx 14.80%
A standard deviation reflecting historical swings.
Sensitivity
1.13
Beta vs benchmark 1.00 · 13% more reactive
How strongly the scheme moves with the index.
Risk-reward
0.65
Sharpe
Excess return gained per unit of volatility.
Capture ratio
119 / 94
Upside / Downside Capture
Share of market gains captured versus losses absorbed.
How far below its previous high it fell
Over the trailing 3Y window the scheme fell −22.30% from its 30 Oct 2024 peak to a 31 Mar 2026 trough, and recovered on 30 Jun 2026 after 91 days.
Max drawdowns
−22.30%
Recovery period
91 days
Scheme Drawdown Trajectory
| Drawdown analysis | Peak | Trough | Depth | Fell over | Recovered | Recovery took |
|---|---|---|---|---|---|---|
| Scheme | 30 Oct 2024 | 31 Mar 2026 | −22.30% | 517 days | 30 Jun 2026 | 91 days |
| Benchmark | 30 Aug 2024 | 28 Feb 2025 | −18.59% | 182 days | – | – |
Scheme
Peak30 Oct 2024
Trough31 Mar 2026
Depth−22.30%
Fell over517 days
Recovered30 Jun 2026
Recovery took91 days
Benchmark
Peak30 Aug 2024
Trough28 Feb 2025
Depth−18.59%
Fell over182 days
Recovered–
Recovery took–
The benchmark's peak, trough and recovery are read off its month-end curve; the scheme's row is measured on daily NAV. · Risk and drawdown use a trailing 3Y window · As on 31 Jul 2026
Portfolio Details : Where the money actually sits
Stocks
31
P/E ratio
63.61
P/B ratio
10.38
Dividend yield
0.11%
Avg market cap
₹91,150 Cr
Median market cap
₹63,024 Cr
Asset class
Equity
Market cap
Large cap34.24%
Mid cap24.73%
Small cap45.05%
Cash & others−4.02%
As on 31 Jul 2026
Let's start a
conversation
conversation
- Compare this AIF against 3,000+ others with our research desk
- Build a long-term portfolio around your goals, not a one-off buy
- Experts with decades of experience.
Private. Personal. No obligation.
We will only use these details to contact you about this enquiry. No spam.