
AIF · Equity · CAT III - LONG ONLY - SMALL CAP & MID CAP
Carnelian Structural Shift Fund
IRRSince inception23.65%
Alpha (3Y)6.63%
3Y return21.04%
Fund age4 yrs 3 mo
Fund Managers
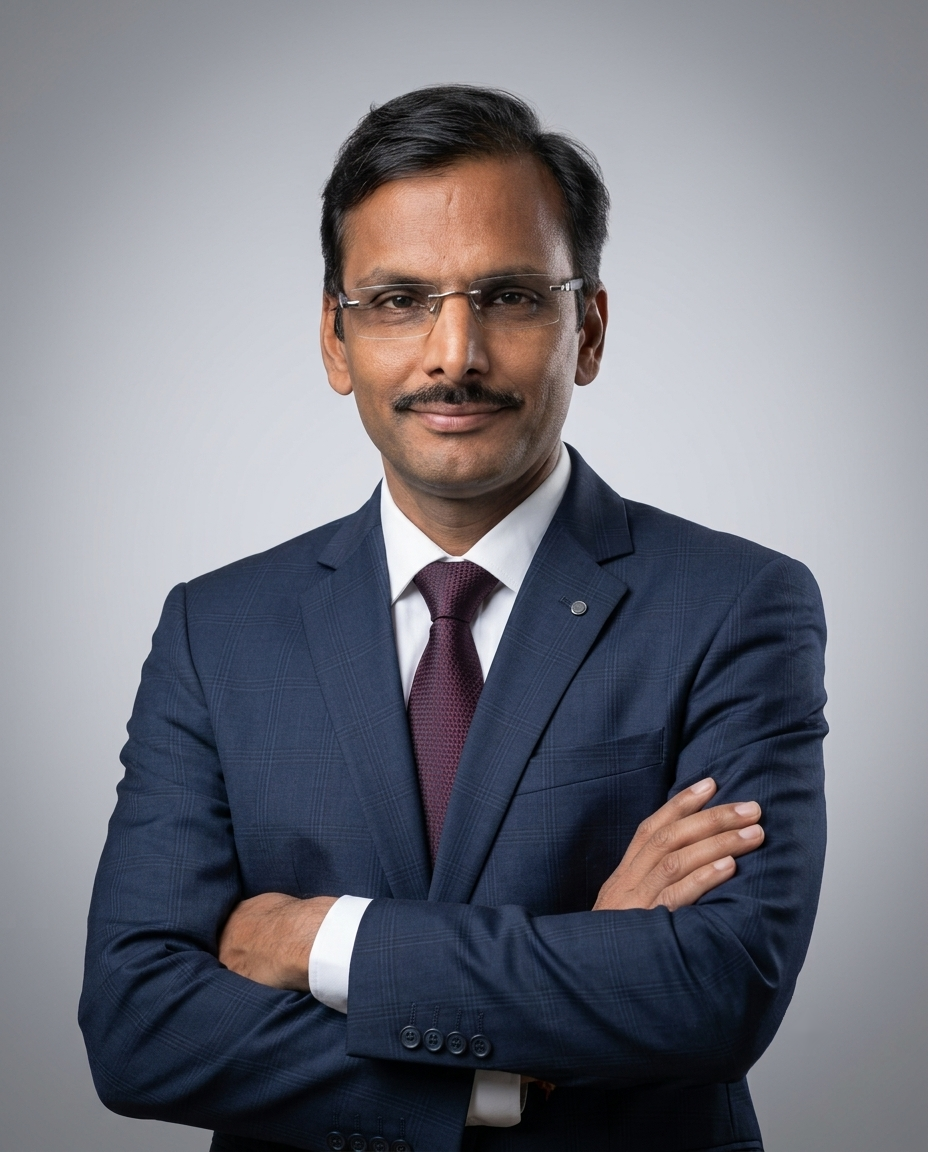
Vikas Khemani (CA,CFA,CS)
Co- Founder/ Fund Manager, Carnelian
Vikas Khemani, with 28 years of extensive experience in capital markets, is the founder of Carnelian Asset Management & Advisors. Established in 2019, this boutique investment management and advisory firm, based in India, manages USD 2.2 bn across various portfolios. Prior to founding Carnelian, Mr. Khemani served as the CEO of Edelweiss Securities Ltd. for 17 years, during which he successfully incubated and developed several businesses into market leaders, including institutional equities, investment banking, and equity research. He is recognized for his strong business acumen and profound understanding of capital markets, earning him a distinguished reputation within Corporate India. In 2014, he was honored with the Young Professional Achievers Award for the service sector by the Institute of Chartered Accountants of India.
Managing AUM₹15,194 Cr
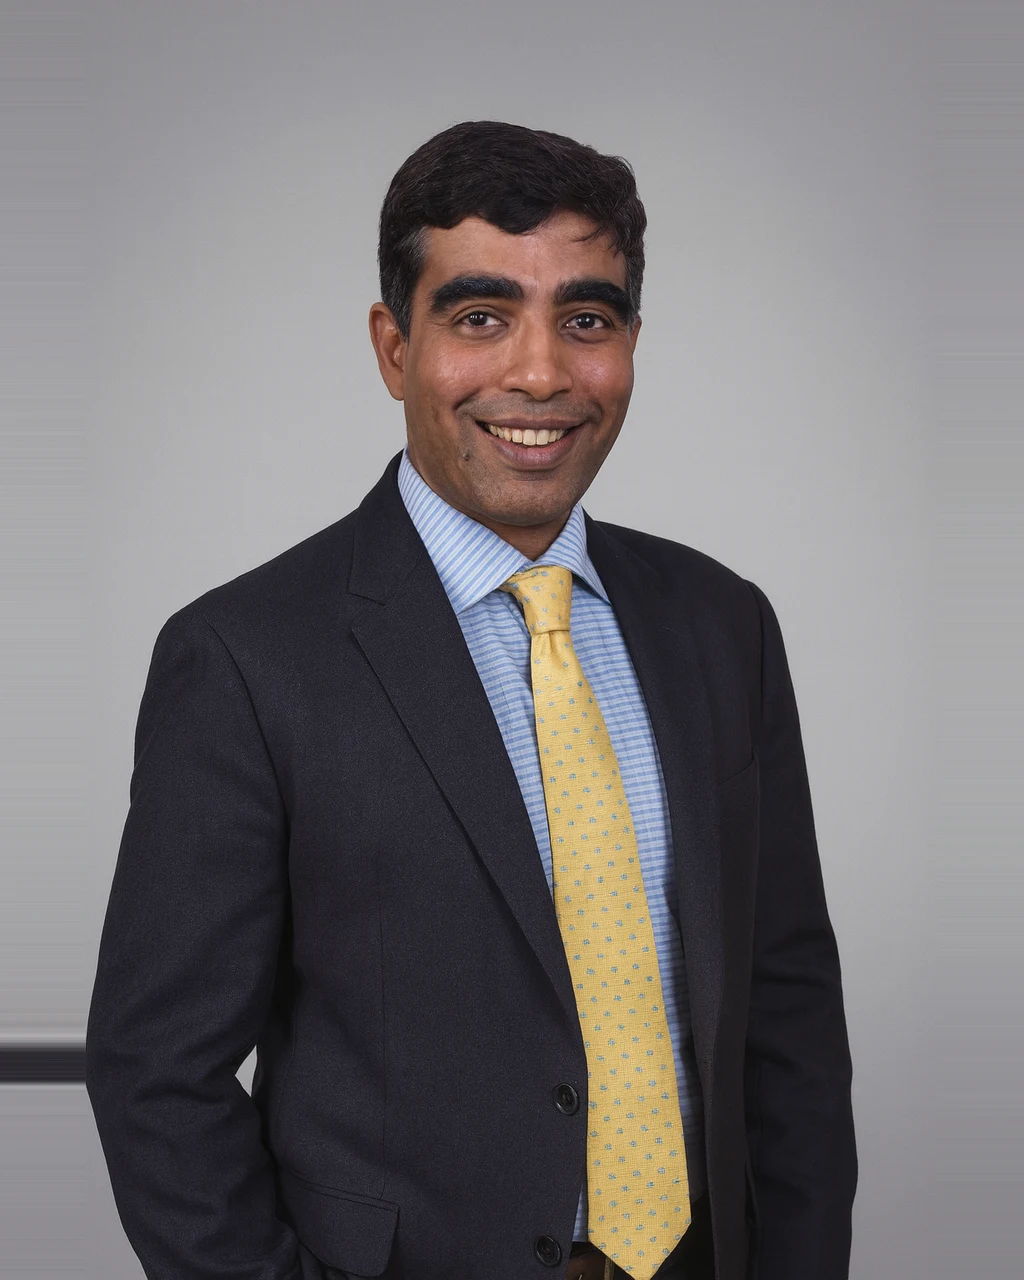
Manoj Bahety (CA, CFA)
Fund Manager, Carnelian
With ~27 years of financial services experience, Manoj Bahety currently serves as the fund manager of Carnelian Asset Management & Advisors. He is a distinguished financial professional known for his innovative approach to forensic research and portfolio management.Before co-founding Carnelian along with Vikas in 2019, Manoj held key roles at Edelweiss Securities, including Deputy Head of Institutional Equity Research, Head of Forensic Research, and Head of Thematic & Mid Cap Research. He is enowned for his non-onsensus research approach and pioneering differentiated forensic research, famously known as"Analysis Beyond Consensus" (ABC Research).ABC Research has been instrumental in aiding global investors to make informed investment decisions based on accurate data rather than reported figures, thereby helping them "avoid pitfalls"—a core virtue of Carnelian In addition to his professional accomplishments, Manoj has actively contributed to the CFA Institute, serving on several committees, including as Chairperson of the India Advocacy Committee and as a member of the Global Capital Markets Policy Council (CDPC) based in the USA.
Managing AUM₹15,194 Cr
Growth of₹Cr
Carnelian Structural Shift
Returns: How it has done
| Scheme / Benchmark | YTD | 1Y | 2Y | 3Y | 5Y | Since inception |
|---|---|---|---|---|---|---|
| Carnelian Structural Shift | 15.60% | 12.76% | 8.32% | 21.04% | — | 23.65% |
| Nifty 500 | −1.07% | 1.95% | −0.66% | 10.65% | — | 10.28% |
| Excess over benchmark | 16.67% | 10.81% | 8.98% | 10.39% | — | 13.37% |
Returns up to one year are absolute; two years and above are annualised (CAGR). YTD is calendar-year-to-date. As on 31 Jul 2026.
Risk : What you take on to earn the return
Volatility
22.61%
Benchmark approx 14.84%
A standard deviation reflecting historical swings.
Sensitivity
1.14
Beta vs benchmark 1.00 · 14% more reactive
How strongly the scheme moves with the index.
Risk-reward
0.65
Sharpe
Excess return gained per unit of volatility.
Capture ratio
126 / 94
Upside / Downside Capture
Share of market gains captured versus losses absorbed.
How far below its previous high it fell
Over the trailing 3Y window the scheme fell −24.89% from its 30 Jan 2025 peak to a 31 Mar 2026 trough, and recovered on 31 Jul 2026 after 122 days.
Max drawdowns
−24.89%
Recovery period
122 days
Scheme Drawdown Trajectory
| Drawdown analysis | Peak | Trough | Depth | Fell over | Recovered | Recovery took |
|---|---|---|---|---|---|---|
| Scheme | 30 Jan 2025 | 31 Mar 2026 | −24.89% | 425 days | 31 Jul 2026 | 122 days |
| Benchmark | 30 Aug 2024 | 28 Feb 2025 | −18.59% | 182 days | – | – |
Scheme
Peak30 Jan 2025
Trough31 Mar 2026
Depth−24.89%
Fell over425 days
Recovered31 Jul 2026
Recovery took122 days
Benchmark
Peak30 Aug 2024
Trough28 Feb 2025
Depth−18.59%
Fell over182 days
Recovered–
Recovery took–
The benchmark's peak, trough and recovery are read off its month-end curve; the scheme's row is measured on daily NAV. · Risk and drawdown use a trailing 3Y window · As on 31 Jul 2026
Portfolio Details : Where the money actually sits
Avg market cap
₹40,220 Cr
Asset class
Equity
Market cap
Large cap7.48%
Mid cap27.53%
Small cap63.66%
Cash & others1.33%
As on 31 Jul 2026
Let's start a
conversation
conversation
- Compare this AIF against 3,000+ others with our research desk
- Build a long-term portfolio around your goals, not a one-off buy
- Experts with decades of experience.
Private. Personal. No obligation.
We will only use these details to contact you about this enquiry. No spam.