PMS · Equity · Multi Cap
Alchemy - Ascent
Fund size₹234 Cr
Alpha (3Y)−3.07%
3Y return8.50%
Fund age6 yrs 11 mo
Fund Managers
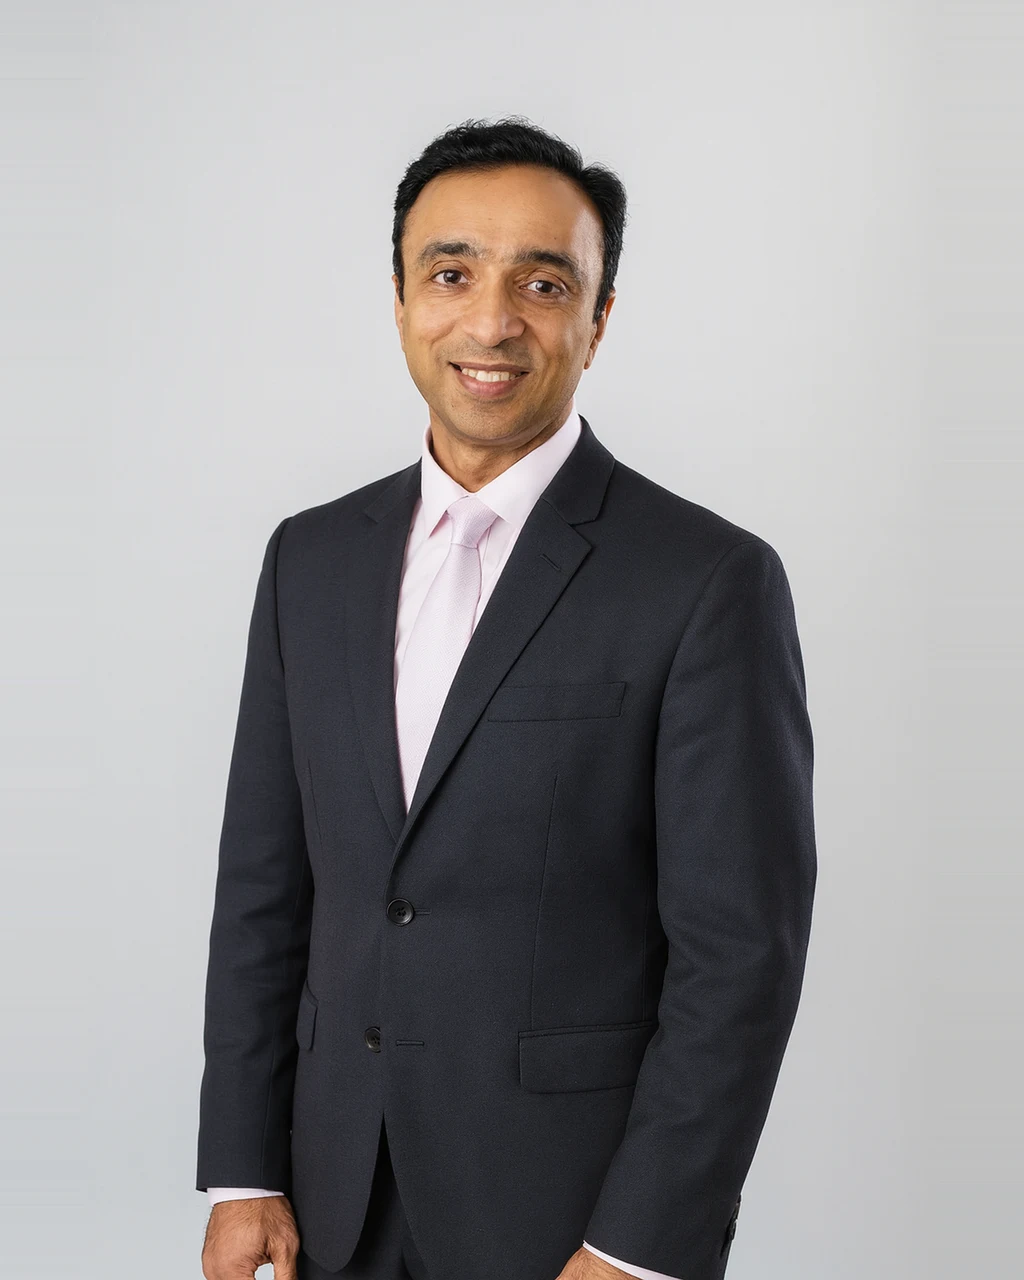
Alok Agarwal
Head - Quant And Fund Manager, Alchemy
Alok has over 21 years of experience in Finance and Markets, primarily in equity research and fund management. He worked with PGIM India AMC, where he managed their flagship fund and headed their Offshore Equity Desk. Alok has also worked with Deutsche Asset Management, KR Choksey Shares & Securities, E-nxt Financials Ltd and Pinnacle Academy. He holds a degree of M.Com and MS (Finance) & has also completed CA, CFA & CMT
Managing AUM₹1,814 Cr

Deven Ved
Co-fm, Alchemy
Deven has over 17 years of diverse business experience in financial programming and modelling, program management, shareholder reporting and consulting. In his previous role at HDFC Ergo General Insurance he spearheaded the launch of automated underwriting rule engine, enabling instantaneous policy issuance. Deven’s professional experience also includes working with financial institutions like Bharti AXA, Tata AIA Life and Deloitte Consulting. He’s highly analytical in his approach and holds a Post Graduate Diploma in Actuarial Science and Bachelor of Science Degree in Statistics from St. Xaviers College, Mumbai
Managing AUM₹257 Cr
Growth of₹Cr
Alchemy Ascent
Returns: How it has done
| Scheme / Benchmark | YTD | 1Y | 2Y | 3Y | 5Y | Since inception |
|---|---|---|---|---|---|---|
| Alchemy Ascent | 10.41% | 14.07% | −10.26% | 8.50% | 7.26% | 13.68% |
| Nifty 500 | −1.02% | 4.72% | −0.11% | 12.09% | 10.91% | 15.84% |
| Excess over benchmark | 11.43% | 9.35% | −10.15% | −3.59% | −3.65% | −2.16% |
Returns up to one year are absolute; two years and above are annualised (CAGR). YTD is calendar-year-to-date. As on 31 Aug 2026.
Risk : What you take on to earn the return
Volatility
19.82%
Benchmark approx 14.77%
A standard deviation reflecting historical swings.
Sensitivity
1.09
Beta vs benchmark 1.00 · 9% more reactive
How strongly the scheme moves with the index.
Risk-reward
0.25
Sharpe
Excess return gained per unit of volatility.
Capture ratio
103 / 123
Upside / Downside Capture
Share of market gains captured versus losses absorbed.
How far below its previous high it fell
Over the trailing 3Y window the scheme fell −34.92% from its 16 Oct 2024 peak to a 23 Mar 2026 trough. It has not yet recovered.
Max drawdowns
−34.92%
Scheme Drawdown Trajectory
| Drawdown analysis | Peak | Trough | Depth | Fell over | Recovered | Recovery took |
|---|---|---|---|---|---|---|
| Scheme | 16 Oct 2024 | 23 Mar 2026 | −34.92% | 523 days | – | – |
| Benchmark | 30 Aug 2024 | 28 Feb 2025 | −18.59% | 182 days | – | – |
Scheme
Peak16 Oct 2024
Trough23 Mar 2026
Depth−34.92%
Fell over523 days
Recovered–
Recovery took–
Benchmark
Peak30 Aug 2024
Trough28 Feb 2025
Depth−18.59%
Fell over182 days
Recovered–
Recovery took–
The benchmark's peak, trough and recovery are read off its month-end curve; the scheme's row is measured on daily NAV. · Risk and drawdown use a trailing 3Y window · As on 31 Aug 2026
Portfolio Details : Where the money actually sits
Stocks
70
P/E ratio
29.14
P/B ratio
4.28
Dividend yield
0.26%
Avg market cap
₹89,006 Cr
Median market cap
₹62,815 Cr
Asset class
Equity
Market cap
Large cap25.00%
Mid cap33.00%
Small cap39.00%
Cash & others3.00%
As on 31 Aug 2026
Fees
A fixed plan is cheaper when returns are strong. A performance plan costs less in lean years and shares the upside only when the fund beats a hurdle. Both cost the same at a 16.67% gross return.
 FixedPlan A · Simple
Fixed Management Fee2.50% / yr
Performance FeeNone
Hurdle RateNot applicable
 VariablePlan B · Shared upside
Fixed Management Fee1.50% / yr
Performance Fee15% of profit
Hurdle RateAbove 10%
Exit load 1.00% within 1 year, nil after 2 years. Lock-in: Nil.
Let's start a
conversation
conversation
- Compare this PMS against 3,000+ others with our research desk
- Build a long-term portfolio around your goals, not a one-off buy
- Experts with decades of experience.
Private. Personal. No obligation.
We will only use these details to contact you about this enquiry. No spam.