
PMS · Equity · Large & Mid Cap
Alchemy Smart Alpha 250
Fund size₹751 Cr
Alpha (3Y)5.56%
3Y return18.72%
Fund age3 yrs
From the research desk
A systematic approach to picking quality growth.
Alchemy Smart Alpha 250 is Alchemy Capital's Large and Midcap PMS strategy, built on a disciplined, objective and data driven investment framework. It evaluates the top 250 companies by market capitalisation through a proprietary eQGP framework across four dimensions, environment, quality, growth and price action, to identify businesses with strong growth characteristics. Companies are ranked using a weighted composite score, with the highest ranked names selected for the portfolio.
A framework that removes emotion from selection
Companies are evaluated across four dimensions and ranked using a weighted composite score, rather than subjective judgement calls.
Shifts posture with the cycle, not fixed exposure
Most equity strategies hold a similar stance throughout the cycle. This one rates liquidity, rates, growth and policy, then tilts aggressive or defensive as the environment changes.
Rebalances as signals shift, not on a fixed calendar
Rebalancing is triggered by the dynamic integration of macro, fundamental and market signals rather than a set quarterly or annual review date.
Fund Managers
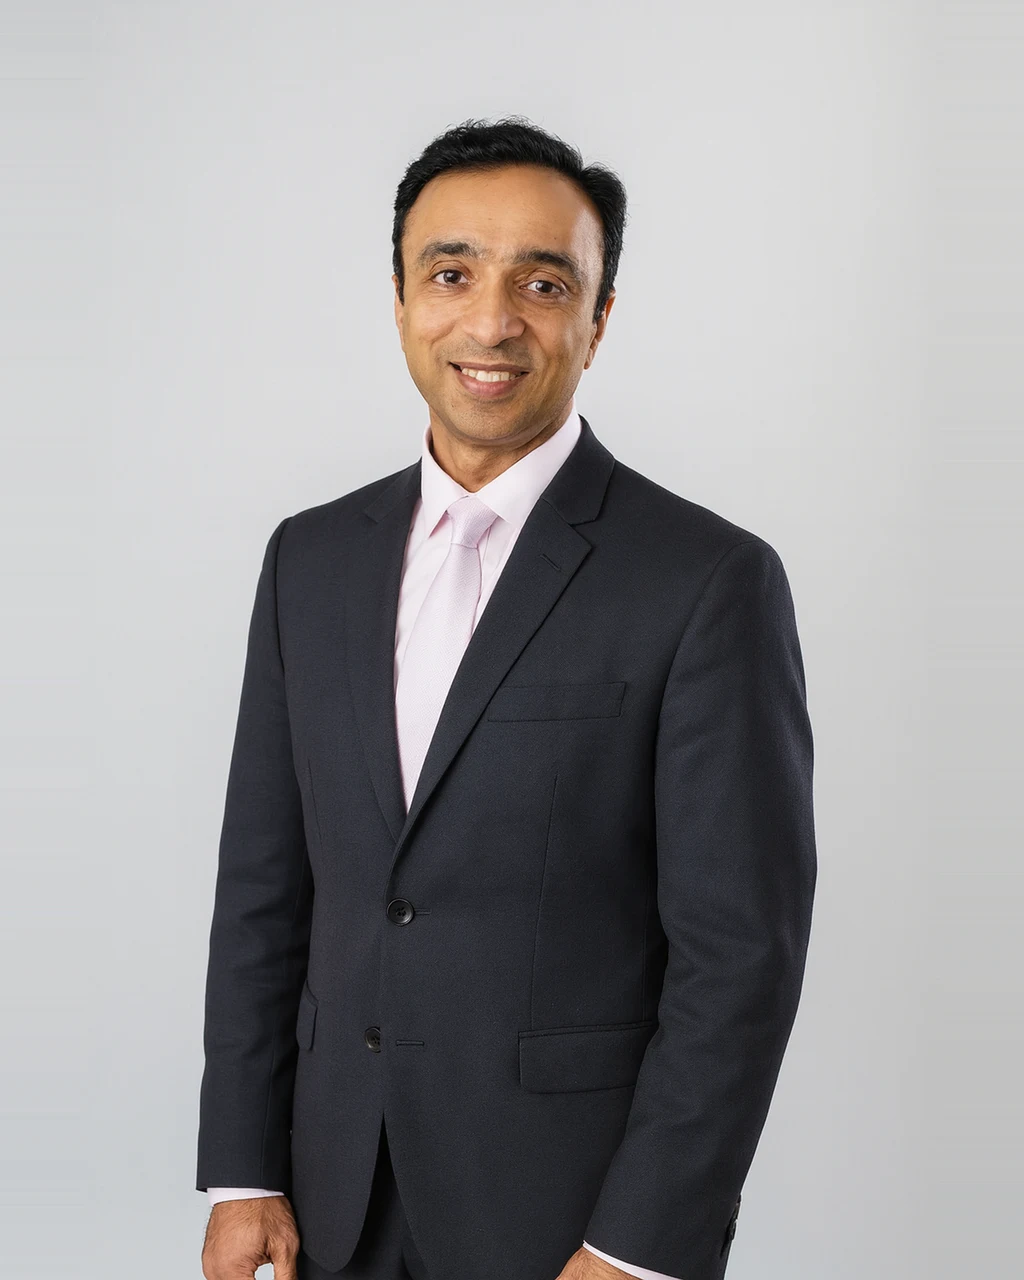
Alok Agarwal
Head - Quant And Fund Manager, Alchemy
Alok has over 21 years of experience in Finance and Markets, primarily in equity research and fund management. He worked with PGIM India AMC, where he managed their flagship fund and headed their Offshore Equity Desk. Alok has also worked with Deutsche Asset Management, KR Choksey Shares & Securities, E-nxt Financials Ltd and Pinnacle Academy. He holds a degree of M.Com and MS (Finance) & has also completed CA, CFA & CMT
Managing AUM₹1,814 Cr
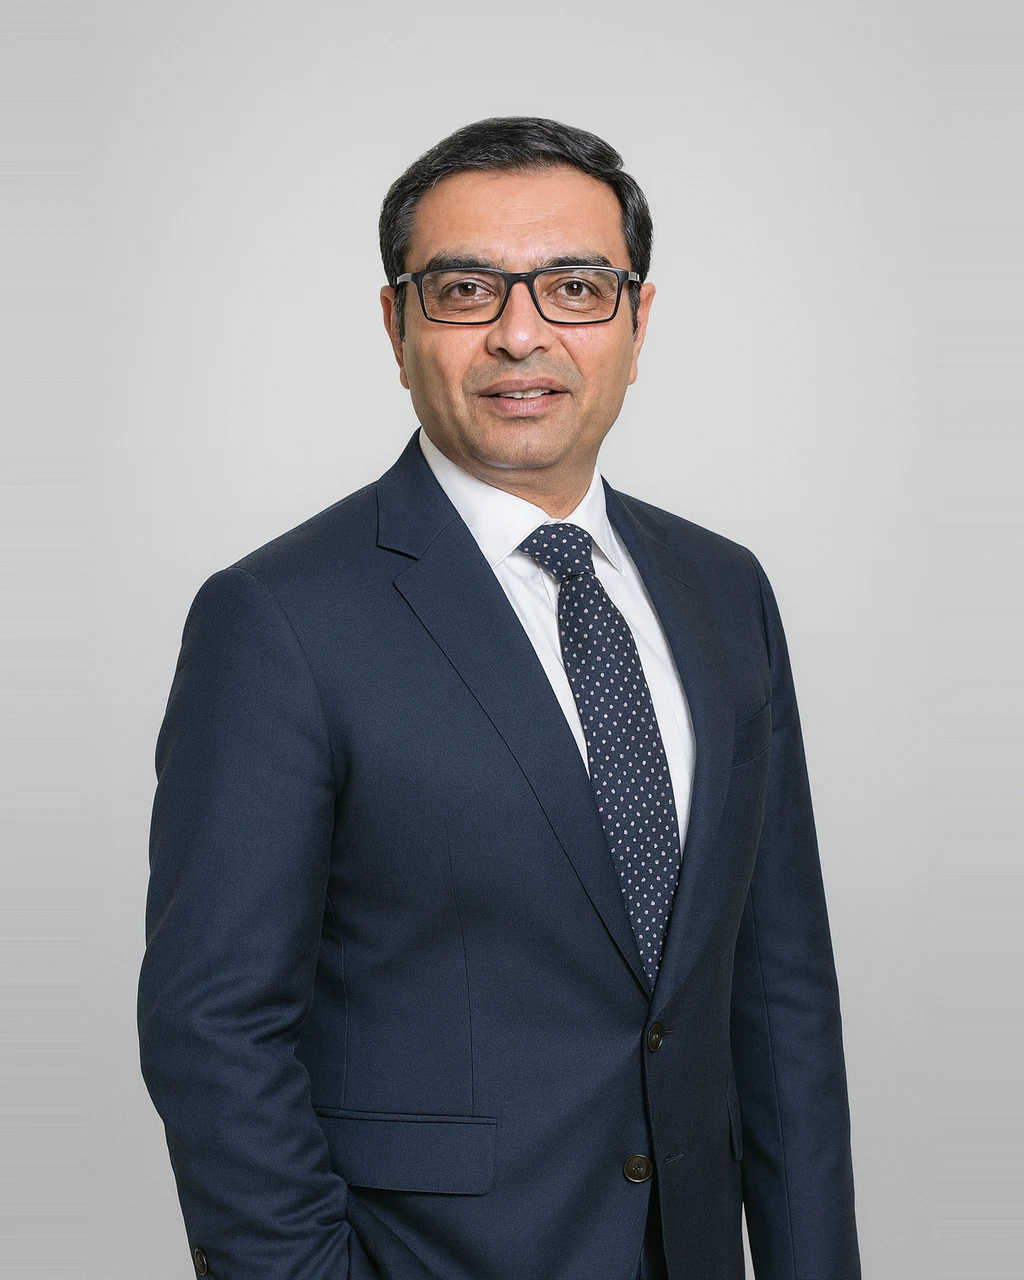
Mr. Hiren Ved
Director And CIO, Alchemy
Hiren Ved, an equity market veteran, serves as the Whole-Time Director, and CIO at Alchemy Capital Management where he has been leading the firm’s Asset Management business. With over 30 years of experience in the Indian equities market, Hiren has developed a sustainable long-term investment philosophy based on fundamental research. He is known for his deep sector knowledge, bottom-up research skills and stock picking abilities. Hiren manages and advises funds over USD 931 million (as on June 30, 2023) across domestic PMS and offshore institutional mandates for Alchemy Capital. He holds a graduate degree in Accounting from Mumbai University and a post-graduation in Management & Cost Accounting from The Institute of Cost Accountants of India.
Managing AUM₹8,237 Cr
Growth of₹Cr
Alchemy Smart Alpha 250
Returns: How it has done
| Scheme / Benchmark | YTD | 1Y | 2Y | 3Y | 5Y | Since inception |
|---|---|---|---|---|---|---|
| Alchemy Smart Alpha 250 | 8.88% | 18.36% | 0.34% | 18.72% | — | 18.90% |
| Nifty 500 | −1.02% | 4.72% | −0.11% | 12.09% | — | 11.71% |
| Excess over benchmark | 9.90% | 13.64% | 0.45% | 6.63% | — | 7.19% |
Returns up to one year are absolute; two years and above are annualised (CAGR). YTD is calendar-year-to-date. As on 31 Aug 2026.
Risk : What you take on to earn the return
Volatility
21.62%
Benchmark approx 14.88%
A standard deviation reflecting historical swings.
Sensitivity
1.18
Beta vs benchmark 1.00 · 18% more reactive
How strongly the scheme moves with the index.
Risk-reward
0.66
Sharpe
Excess return gained per unit of volatility.
Capture ratio
126 / 100
Upside / Downside Capture
Share of market gains captured versus losses absorbed.
How far below its previous high it fell
Over the trailing 3Y window the scheme fell −29.06% from its 11 Jul 2024 peak to a 07 Apr 2025 trough, and recovered on 06 May 2026 after 394 days.
Max drawdowns
−29.06%
Recovery period
394 days
Scheme Drawdown Trajectory
| Drawdown analysis | Peak | Trough | Depth | Fell over | Recovered | Recovery took |
|---|---|---|---|---|---|---|
| Scheme | 11 Jul 2024 | 07 Apr 2025 | −29.06% | 270 days | 06 May 2026 | 394 days |
| Benchmark | 30 Aug 2024 | 28 Feb 2025 | −18.59% | 182 days | – | – |
Scheme
Peak11 Jul 2024
Trough07 Apr 2025
Depth−29.06%
Fell over270 days
Recovered06 May 2026
Recovery took394 days
Benchmark
Peak30 Aug 2024
Trough28 Feb 2025
Depth−18.59%
Fell over182 days
Recovered–
Recovery took–
The benchmark's peak, trough and recovery are read off its month-end curve; the scheme's row is measured on daily NAV. · Risk and drawdown use a trailing 3Y window · As on 31 Aug 2026
Portfolio Details : Where the money actually sits
Avg market cap
₹1.42 L Cr
Asset class
Equity
Market cap
Large cap37.00%
Mid cap53.00%
Small cap9.00%
Cash & others1.00%
As on 31 Aug 2026
Fees
A fixed plan is cheaper when returns are strong. A performance plan costs less in lean years and shares the upside only when the fund beats a hurdle. Both cost the same at a 16.67% gross return.
 FixedPlan A · Simple
Fixed Management Fee2.50% / yr
Performance FeeNone
Hurdle RateNot applicable
 VariablePlan B · Shared upside
Fixed Management Fee1.50% / yr
Performance Fee15% of profit
Hurdle RateAbove 10%
Exit load 1.00% within 1 year, nil after 2 years. Lock-in: Nil.
Let's start a
conversation
conversation
- Compare this PMS against 3,000+ others with our research desk
- Build a long-term portfolio around your goals, not a one-off buy
- Experts with decades of experience.
Private. Personal. No obligation.
We will only use these details to contact you about this enquiry. No spam.