PMS · Equity · Multi Cap
Alder Capital - B2C Growth
Fund size₹39 Cr
Alpha (3Y)−11.73%
3Y return4.99%
Fund age8 yrs 1 mo
Fund Managers
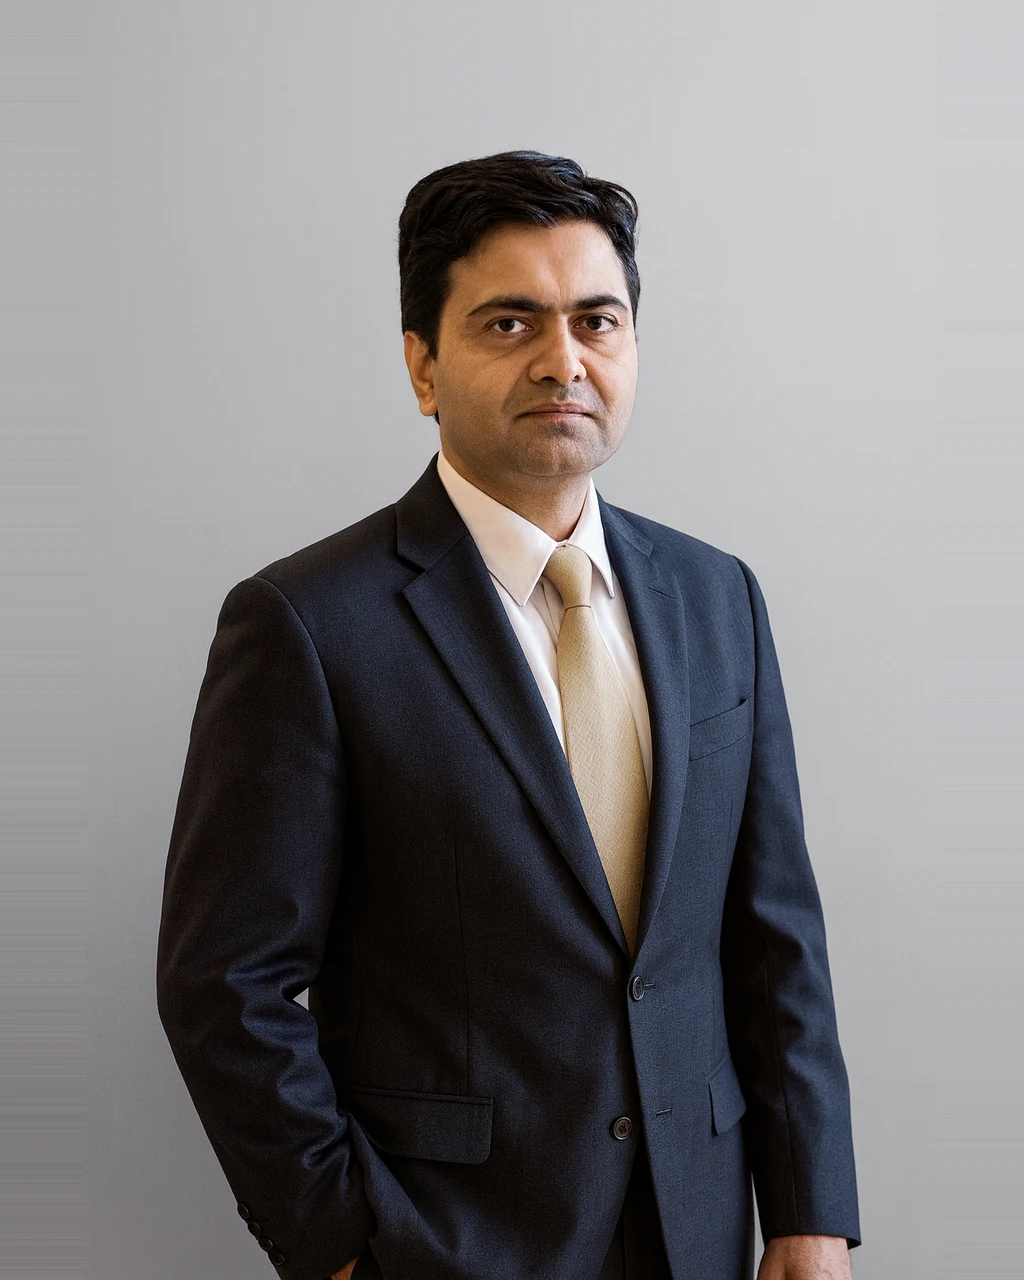
Hemant Patel
Fund Manager, Alder
Hemant is the Managing partner and Founder of Alder Capital. He has over 20 years of experience in capital markets, with 15 years in institutional equity research, advising some of the largest global and domestic institutional investors. His 10 years tenure with Axis Capital team (earlier known as Enam Securities), culminated in his role as Executive Director - Consumer Equity Research. He has been voted by Wall Street Journal as India's top analyst for home and personal care sector and has received 2 consecutive awards from Reuters StarMine for consumer staples category. Hemant has obtained his MBA from Australian Graduate School of Management, University of NSW in 2000
Managing AUM₹39 Cr
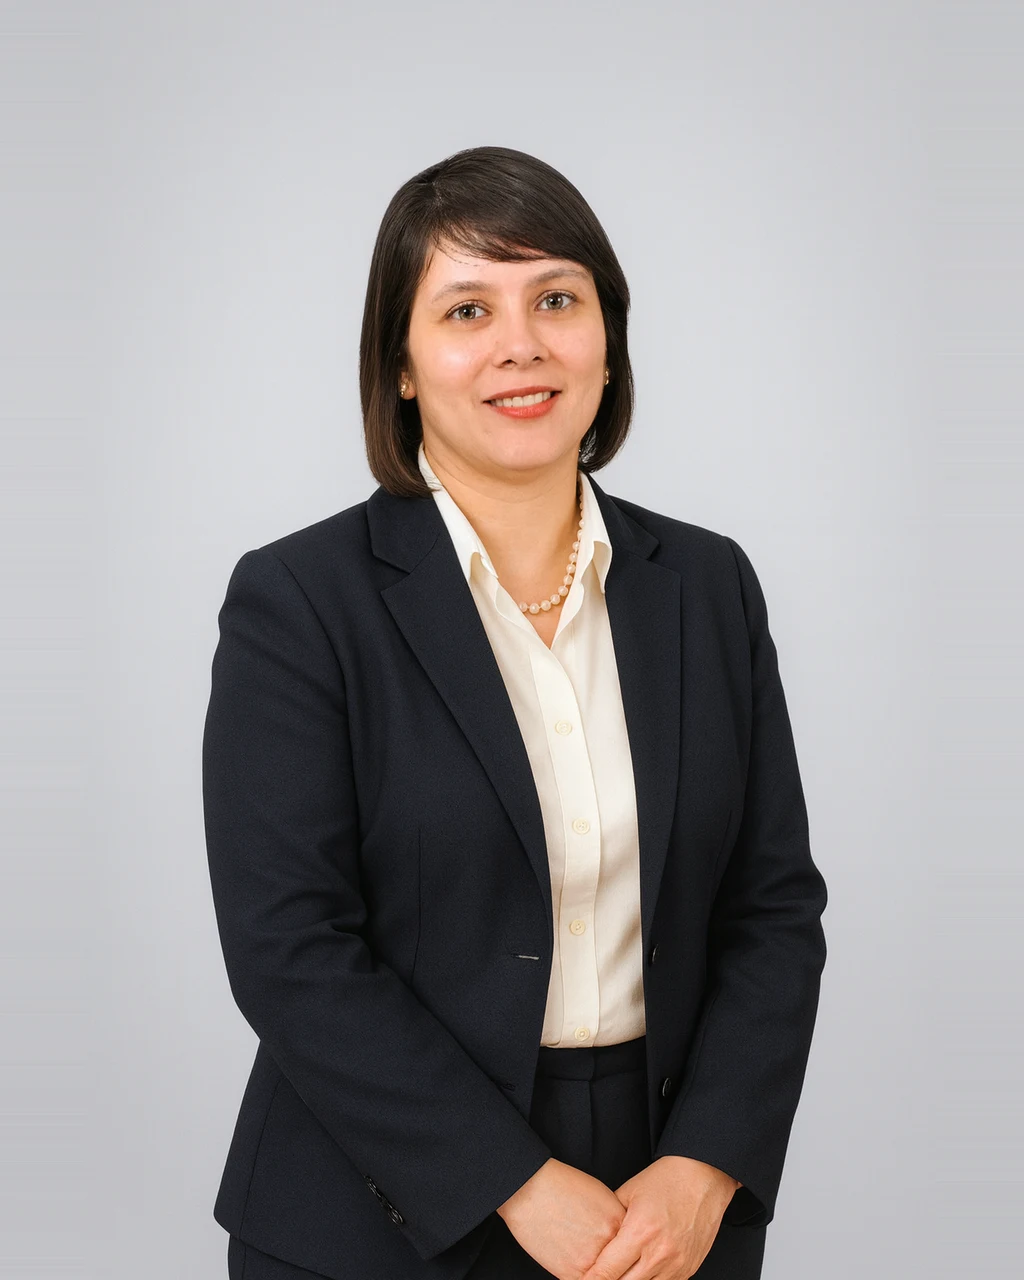
Rakhi Prasad
Fund Manager, Alder
Rakhi has over 19 years of experience across asset management, investment banking, private equity, and risk management. She started her career at Goldman Sachs, N.Y. where she built strategies to hedge against counterparty risk. At Enam Securities, one of the leading investment banking and financial market intermediary, she played a critical role in mandates relating to consumer sector. As Director of operations at Matrix Partners India, she managed investor relations and fund portfolio reporting. She has been honoured as India’s Top 100 Women in Finance in 2020 by AIWMI. Rakhi received her BA Economics, Lady Shri Ram College; BS Computer Science, University of Michigan, Ann Arbor and MS Financial Engineering, Columbia University, New York.
Managing AUM₹39 Cr
Growth of₹Cr
Alder Capital B2C Growth
Returns: How it has done
| Scheme / Benchmark | YTD | 1Y | 2Y | 3Y | 5Y | Since inception |
|---|---|---|---|---|---|---|
| Alder Capital B2C Growth | — | 13.01% | −4.12% | 4.99% | 7.54% | 12.40% |
| Nifty 500 | −8.38% | 13.44% | 12.09% | 20.29% | 16.02% | 14.42% |
| Excess over benchmark | — | −0.43% | −16.21% | −15.30% | −8.48% | −2.02% |
Returns up to one year are absolute; two years and above are annualised (CAGR). YTD is calendar-year-to-date. As on 30 Nov 2023.
Risk : What you take on to earn the return
Volatility
15.64%
Benchmark approx 13.49%
A standard deviation reflecting historical swings.
Sensitivity
0.86
Beta vs benchmark 1.00 · 14% less reactive
How strongly the scheme moves with the index.
Risk-reward
−0.05
Sharpe
Excess return gained per unit of volatility.
Capture ratio
65 / 122
Upside / Downside Capture
Share of market gains captured versus losses absorbed.
Portfolio Details : Where the money actually sits
Stocks
16
P/E ratio
41.05
P/B ratio
5.24
Dividend yield
0.87%
Avg market cap
₹2.30 L Cr
Median market cap
₹59,684 Cr
Asset class
Equity
Market cap
Large cap44.32%
Mid cap20.28%
Small cap21.85%
Cash & others13.55%
As on 30 Nov 2023
Fees
A fixed plan is cheaper when returns are strong. A performance plan costs less in lean years and shares the upside only when the fund beats a hurdle. Both cost the same at a 16.67% gross return.
 FixedPlan A · Simple
Fixed Management Fee2.50% / yr
Performance FeeNone
Hurdle RateNot applicable
 VariablePlan B · Shared upside
Fixed Management Fee1.50% / yr
Performance Fee15% of profit
Hurdle RateAbove 10%
No exit load. Lock-in: Nil.
Let's start a
conversation
conversation
- Compare this PMS against 3,000+ others with our research desk
- Build a long-term portfolio around your goals, not a one-off buy
- Experts with decades of experience.
Private. Personal. No obligation.
We will only use these details to contact you about this enquiry. No spam.