PMS · Equity · Multi Cap
Aurum Multiplier Portfolio
Fund size₹42 Cr
Alpha (3Y)4.97%
3Y return17.77%
Fund age6 yrs 8 mo
Fund Managers
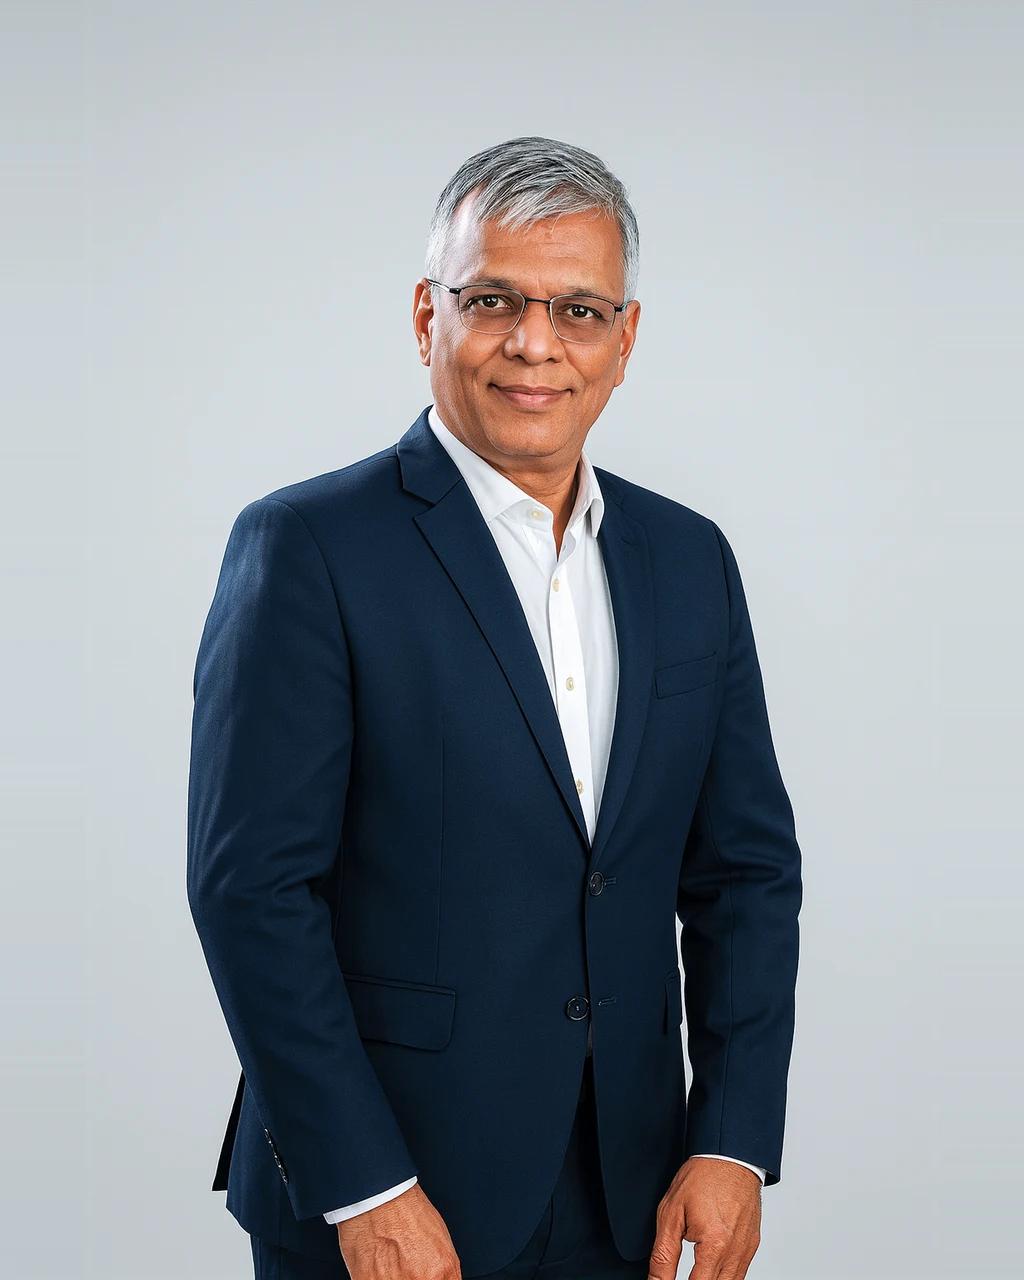
Sandeep Daga
Founder, MD & CIO, Nine Rivers
A Mid-market focused individual having 25 years of India-centric public and private equity investing experience. He occupied board positions on listed and PE funded companies as an Independent Director. Previously, Partner at Frontline Ventures and Head of B2B Investments at ICICI Ventures. He holds an MBA in Finance from NMIMS, Mumbai and a Bachelors in Engineering from Amravati University. He has a strong network of relationships in the corporate and financial world.
Managing AUM₹750 Cr

Kunal Sabnis
CFA Portfolio Manager, Nine Rivers
14+ years of experience public market investing in buy and sell side roles. Previously with VEC Investments in a sector agnostic role focused on mid and small caps. MBA Finance from Mumbai University and CFA Charter holder from CFA Institute, USA.
Managing AUM₹42 Cr
Pragati Khadse
Senior Portfolio Manager, Nine Rivers
22+ years of public market investing experience across sectors. Previously with JP Morgan Services, Citi Investment Research & IIFL Institutional Equities .MBA Finance, IIM-C, BE from Amravati University.
Managing AUM₹42 Cr
Growth of₹Cr
Aurum Multiplier
Returns: How it has done
| Scheme / Benchmark | YTD | 1Y | 2Y | 3Y | 5Y | Since inception |
|---|---|---|---|---|---|---|
| Aurum Multiplier | 16.03% | 12.76% | 8.05% | 17.77% | 17.56% | 17.72% |
| Nifty 500 | −1.02% | 4.72% | −0.11% | 12.09% | 10.90% | 15.19% |
| Excess over benchmark | 17.05% | 8.04% | 8.16% | 5.68% | 6.66% | 2.53% |
Returns up to one year are absolute; two years and above are annualised (CAGR). YTD is calendar-year-to-date. As on 31 Aug 2026.
Risk : What you take on to earn the return
Volatility
20.90%
Benchmark approx 14.80%
A standard deviation reflecting historical swings.
Sensitivity
1.13
Beta vs benchmark 1.00 · 13% more reactive
How strongly the scheme moves with the index.
Risk-reward
0.64
Sharpe
Excess return gained per unit of volatility.
Capture ratio
120 / 96
Upside / Downside Capture
Share of market gains captured versus losses absorbed.
How far below its previous high it fell
Over the trailing 3Y window the scheme fell −23.45% from its 29 Nov 2025 peak to a 31 Mar 2026 trough, and recovered on 30 Jun 2026 after 91 days.
Max drawdowns
−23.45%
Recovery period
91 days
Scheme Drawdown Trajectory
| Drawdown analysis | Peak | Trough | Depth | Fell over | Recovered | Recovery took |
|---|---|---|---|---|---|---|
| Scheme | 29 Nov 2025 | 31 Mar 2026 | −23.45% | 122 days | 30 Jun 2026 | 91 days |
| Benchmark | 30 Aug 2024 | 28 Feb 2025 | −18.59% | 182 days | – | – |
Scheme
Peak29 Nov 2025
Trough31 Mar 2026
Depth−23.45%
Fell over122 days
Recovered30 Jun 2026
Recovery took91 days
Benchmark
Peak30 Aug 2024
Trough28 Feb 2025
Depth−18.59%
Fell over182 days
Recovered–
Recovery took–
The benchmark's peak, trough and recovery are read off its month-end curve; the scheme's row is measured on daily NAV. · Risk and drawdown use a trailing 3Y window · As on 31 Aug 2026
Portfolio Details : Where the money actually sits
Avg market cap
₹44,500 Cr
Asset class
Equity
Top 5 holdings
Greaves Cotton Ltd–
Welspun Corp Ltd–
S J S Enterprises Ltd–
Star Health & Allied Insurance Company Ltd–
Welspun Corp Ltd–
Fees
A fixed plan is cheaper when returns are strong. A performance plan costs less in lean years and shares the upside only when the fund beats a hurdle.
 FixedPlan A · Simple
Fixed Management Fee2.50% / yr
Performance FeeNone
Hurdle RateNot applicable
 VariablePlan B · Simple
Fixed Management Fee0.00% / yr
Performance FeeNone
Hurdle RateAbove 10%
PerformancePlan C · Performance LinkedFixed Management FeeNone
Performance Fee15% of profit
Hurdle RateAbove 10%
Exit load 2.00% within 1 year, nil after 2 years. Lock-in: Nil.
Let's start a
conversation
conversation
- Compare this PMS against 3,000+ others with our research desk
- Build a long-term portfolio around your goals, not a one-off buy
- Experts with decades of experience.
Private. Personal. No obligation.
We will only use these details to contact you about this enquiry. No spam.