PMS · Equity · Thematic
Invesco - Dawn
Fund size₹218 Cr
Alpha (3Y)−2.20%
3Y return9.28%
Fund age9 yrs
Fund Managers
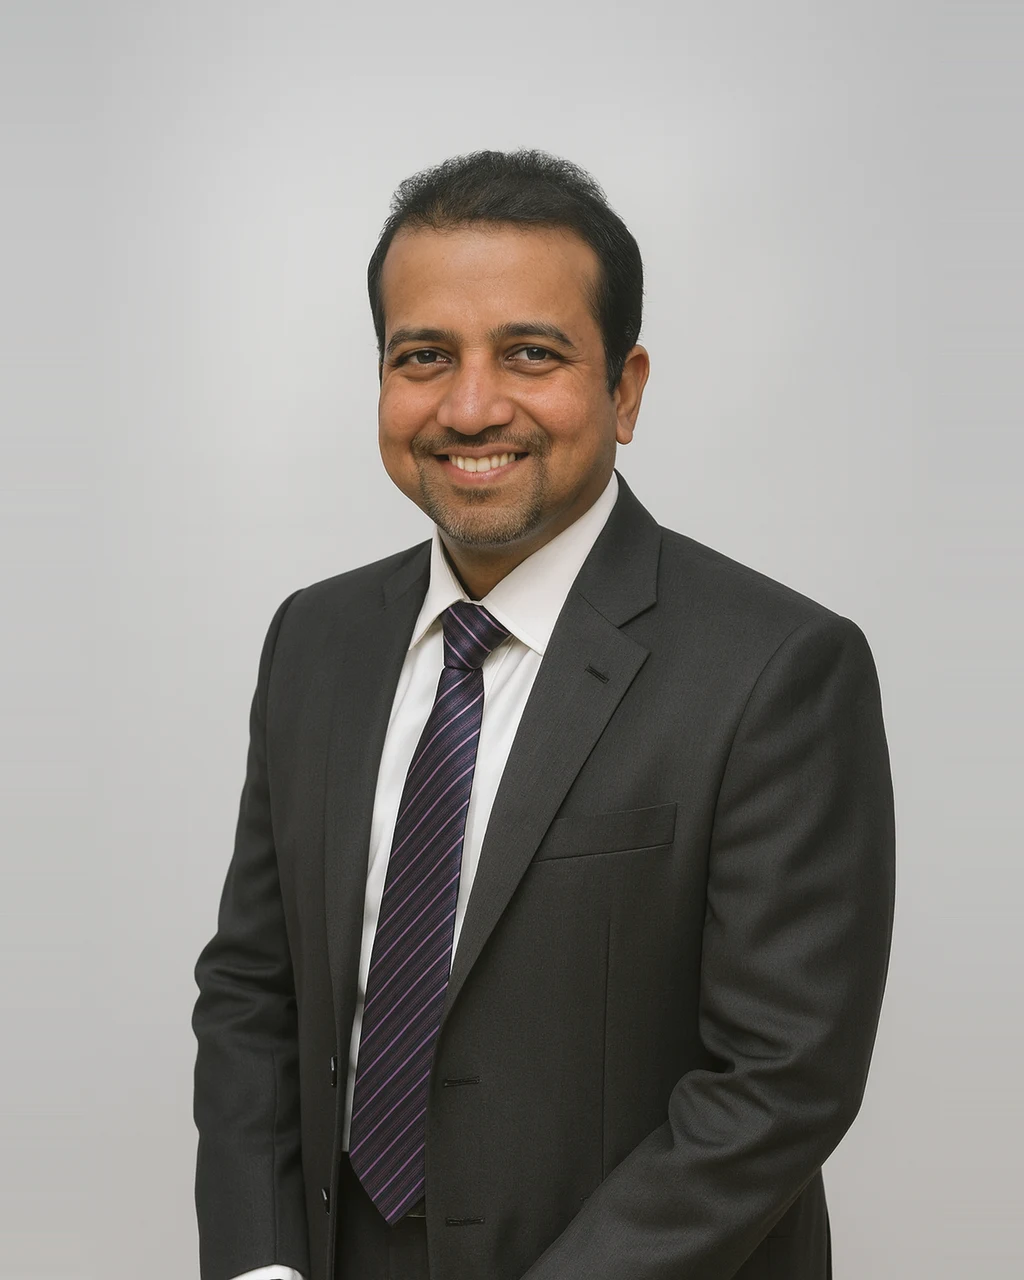
Neelesh Dhamnaskar
Principal Officer & Portfolio Manager, Invesco
Neelesh has over 17 years’ experience in equity markets and financial services domain. Before joining the PMS division of Invesco, Neelesh was managing few equity funds, overseas fund of fund schemes of Invesco Mutual Fund as well as tracking few sectors as an analyst. He was previously working with Enam(now a part of Axis Bank) where he was tracking companies across sectors and assisting the PMS Fund Manager in his investment decisions. Prior to this, he was working with KRC, a domestic broking house in equity research and has also worked with Anand Rathi Securities Limited as a Commodities Research Analyst. Neelesh holds a Commerce degree and an MMS degree with specialization in Finance from Mumbai University
Managing AUM₹613 Cr
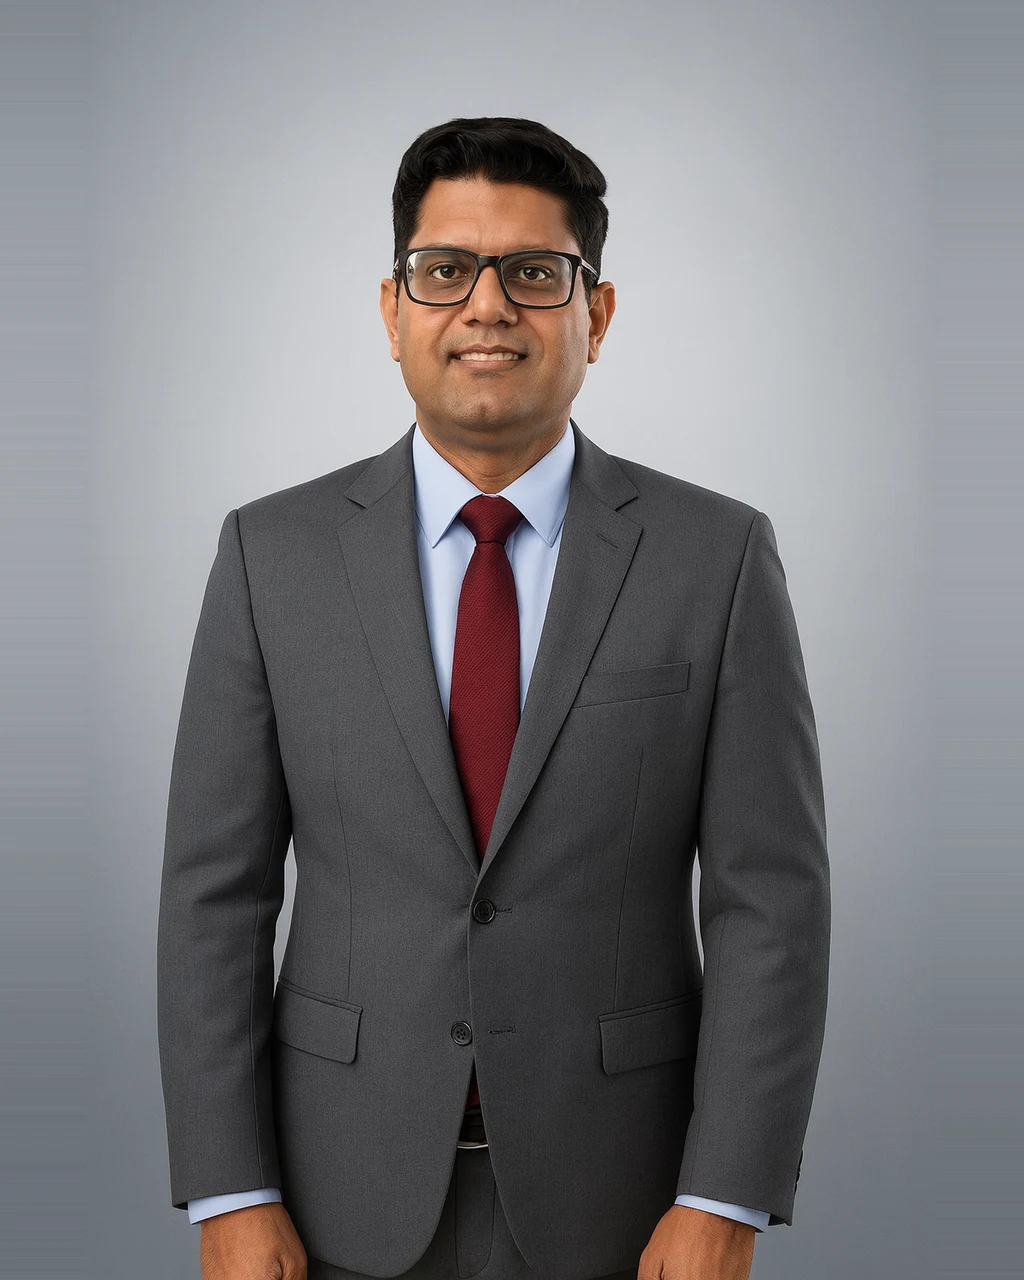
Siddharth Bothra
Principal Officer & Portfolio Manager, Invesco
Siddharth has over 2 decades of experience in equity research and asset management. His asset management experience spans both Mutual Funds and Alternative investments. Prior to joining Invesco, he held roles at Motilal Oswal Financial Services Limited (MOFSL), Ambit Investment Advisors, and Alchemy Share and Stocks Pvt. Limited. Siddharth spent over 18 years at MOFSL across institutional equities and asset management where he was a part of the core team that launched the active mutual fund business in 2013. His expertise covers large-cap, mid-cap, flexi-cap, and hybrid funds. Siddharth is an alumnus of the Indian School of Business (ISB), Hyderabad, and also completed an international MBA student exchange semester at the NYU Stern School of Business, New York.
Managing AUM₹674 Cr
Growth of₹Cr
Invesco Dawn
Returns: How it has done
| Scheme / Benchmark | YTD | 1Y | 2Y | 3Y | 5Y | Since inception |
|---|---|---|---|---|---|---|
| Invesco Dawn | −4.63% | −0.02% | −5.71% | 9.28% | 9.74% | 8.97% |
| Nifty 500 | −1.02% | 4.72% | −0.11% | 12.09% | 10.91% | 12.95% |
| Excess over benchmark | −3.61% | −4.74% | −5.60% | −2.81% | −1.17% | −3.98% |
Returns up to one year are absolute; two years and above are annualised (CAGR). YTD is calendar-year-to-date. As on 31 Aug 2026.
Risk : What you take on to earn the return
Volatility
15.15%
Benchmark approx 14.87%
A standard deviation reflecting historical swings.
Sensitivity
0.95
Beta vs benchmark 1.00 · 5% less reactive
How strongly the scheme moves with the index.
Risk-reward
0.32
Sharpe
Excess return gained per unit of volatility.
Capture ratio
95 / 108
Upside / Downside Capture
Share of market gains captured versus losses absorbed.
How far below its previous high it fell
Over the trailing 3Y window the scheme fell −23.03% from its 26 Sep 2024 peak to a 31 Mar 2026 trough. It has not yet recovered.
Max drawdowns
−23.03%
Scheme Drawdown Trajectory
| Drawdown analysis | Peak | Trough | Depth | Fell over | Recovered | Recovery took |
|---|---|---|---|---|---|---|
| Scheme | 26 Sep 2024 | 31 Mar 2026 | −23.03% | 551 days | – | – |
| Benchmark | 30 Aug 2024 | 28 Feb 2025 | −18.59% | 182 days | – | – |
Scheme
Peak26 Sep 2024
Trough31 Mar 2026
Depth−23.03%
Fell over551 days
Recovered–
Recovery took–
Benchmark
Peak30 Aug 2024
Trough28 Feb 2025
Depth−18.59%
Fell over182 days
Recovered–
Recovery took–
The benchmark's peak, trough and recovery are read off its month-end curve; the scheme's row is measured on daily NAV. · Risk and drawdown use a trailing 3Y window · As on 31 Aug 2026
Portfolio Details : Where the money actually sits
Stocks
24
P/E ratio
46.92
P/B ratio
6.10
Dividend yield
0.20%
Avg market cap
₹4.04 L Cr
Median market cap
₹2.19 L Cr
Asset class
Equity
Market cap
Large cap68.95%
Mid cap10.54%
Small cap11.11%
Cash & others9.40%
As on 31 Aug 2026
Let's start a
conversation
conversation
- Compare this PMS against 3,000+ others with our research desk
- Build a long-term portfolio around your goals, not a one-off buy
- Experts with decades of experience.
Private. Personal. No obligation.
We will only use these details to contact you about this enquiry. No spam.