
PMS · Equity · Multi Cap
Motilal Oswal-Founders
Fund size₹4,148 Cr
Alpha (3Y)6.97%
3Y return19.65%
Fund age3 yrs 5 mo
From the research desk
Backing the people who built it.
Motilal Oswal Founders Strategy is Motilal Oswal Asset Management's PMS strategy built around investing in founder led businesses, based on the belief that aligned ownership, long term capital allocation and entrepreneurial decision making are key drivers of sustained wealth creation.
Ownership as the starting filter, with a defined bar
The investible universe is restricted to businesses where promoter driven ownership runs at least 26%, with meaningful founder or management alignment, before any other screen is applied.
Six themes, one filter
Portfolio construction is organised around six structural themes, China Plus One and Make in India, Financialisation, Tech and Tech Services, Urbanisation, Healthcare Ecosystem and Premiumisation.
Built for a market where dispersion is rising
Return dispersion has increased across sectors and market caps, and the market continues to favour businesses with consistent earnings and disciplined capital allocation. The founder-led ownership screen is positioned to identify these across the market cap spectrum, rather than being confined to one segment.
Fund Managers
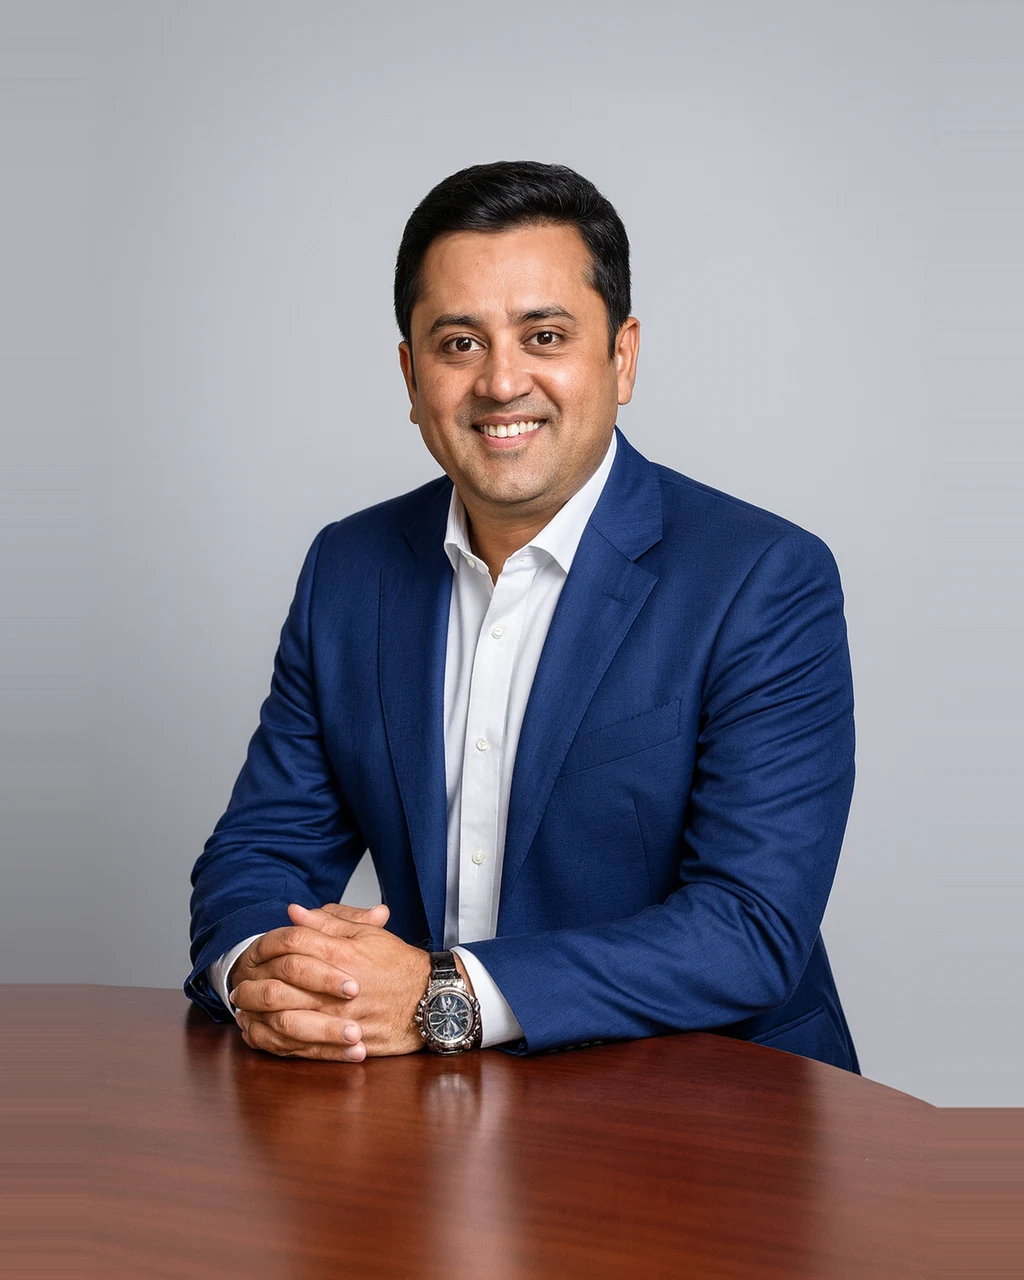
Vaibhav Agrawal
CIO - Alternates, Fund Manager, Motilal Oswal
Vaibhav Agrawal is currently managing ~10,000 crs AUM at Motilal Oswal Asset Management across alternate products. He has also managed a proprietary PMS and has over a decade of experience in stock picking and generating index-beating returns. He has worked as a ratings analyst at CRISIL and investment analyst at Motilal Oswal Asset Management. He holds a Bachelors in Computer Science from the University of Pennsylvania and an MBA from London Business School.
Managing AUM₹12,769 Cr
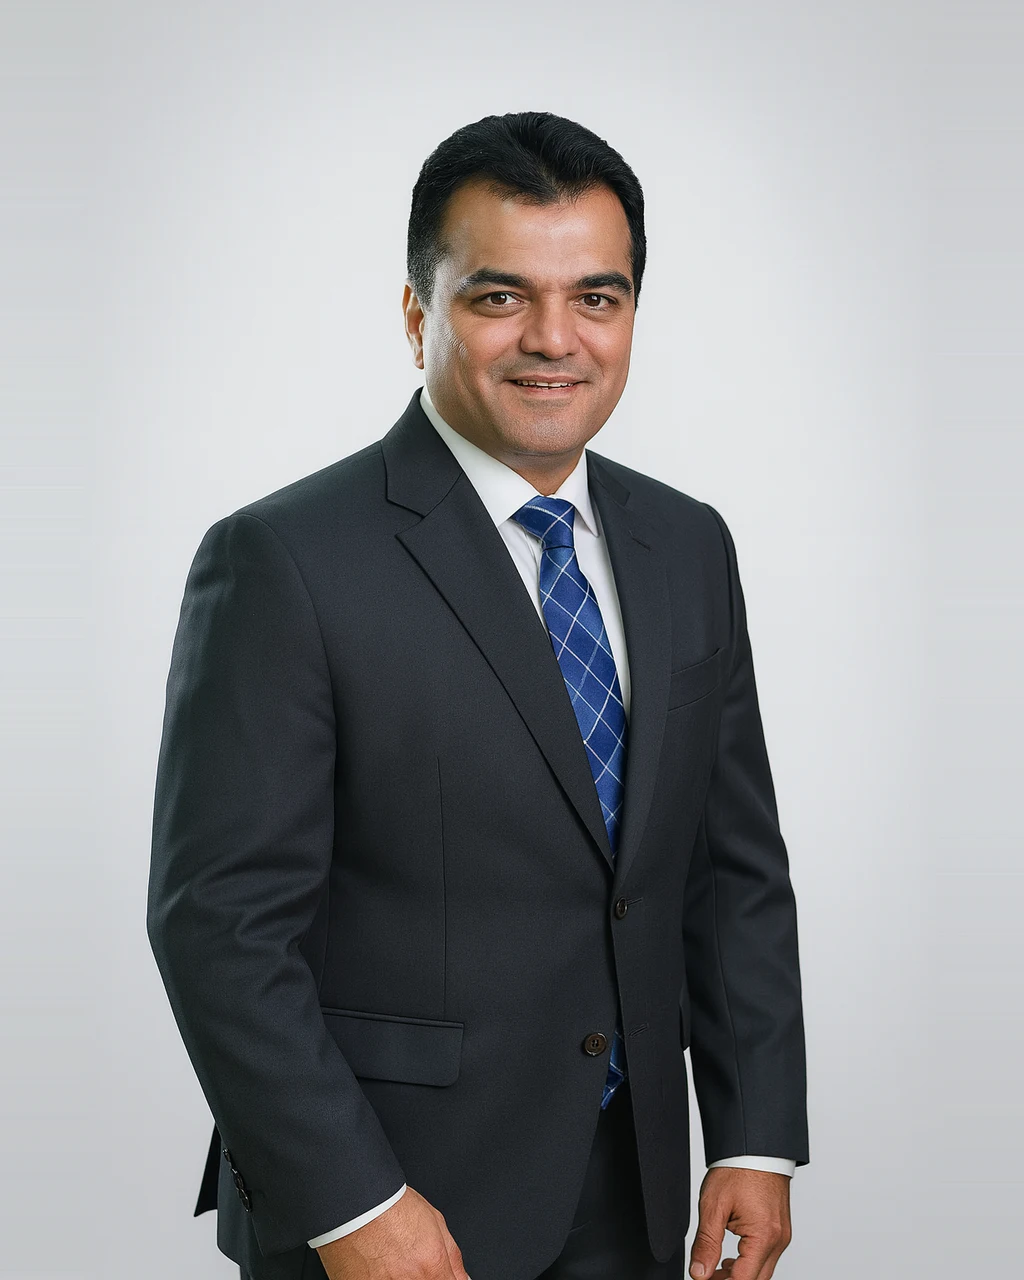
Dhaval Mehta
Fund Manager, Motilal Oswal
Dhaval Mehta brings 14+ years of experience in equity research and portfolio management Prior to joining MOAMC, Dhaval was working with Aditya Birla Sunlife AMC as portfolio Manager, where he used to manage over ~3700 Crs AUM and has been delivered stellar performance across the investment cycles Prior to Aditya Birla Sunlife AMC, he has worked with ASk investment Managers, Emkay Global Financial Services, Ventura Securities and Infosys.
Managing AUM₹4,276 Cr
Growth of₹Cr
Motilal Oswal Founders
Returns: How it has done
| Scheme / Benchmark | YTD | 1Y | 2Y | 3Y | 5Y | Since inception |
|---|---|---|---|---|---|---|
| Motilal Oswal Founders | 7.40% | 3.21% | 3.21% | 19.65% | — | 25.09% |
| Nifty 500 | −1.07% | 2.98% | 0.42% | 11.88% | — | 16.52% |
| Excess over benchmark | 8.47% | 0.23% | 2.79% | 7.77% | — | 8.57% |
Returns up to one year are absolute; two years and above are annualised (CAGR). YTD is calendar-year-to-date. As on 31 Aug 2026.
Risk : What you take on to earn the return
Volatility
22.15%
Benchmark approx 14.79%
A standard deviation reflecting historical swings.
Sensitivity
1.15
Beta vs benchmark 1.00 · 15% more reactive
How strongly the scheme moves with the index.
Risk-reward
0.68
Sharpe
Excess return gained per unit of volatility.
Capture ratio
130 / 99
Upside / Downside Capture
Share of market gains captured versus losses absorbed.
How far below its previous high it fell
Over the trailing 3Y window the scheme fell −27.91% from its 17 Dec 2024 peak to a 03 Mar 2025 trough. It has not yet recovered.
Max drawdowns
−27.91%
Scheme Drawdown Trajectory
| Drawdown analysis | Peak | Trough | Depth | Fell over | Recovered | Recovery took |
|---|---|---|---|---|---|---|
| Scheme | 17 Dec 2024 | 03 Mar 2025 | −27.91% | 76 days | – | – |
| Benchmark | 30 Aug 2024 | 28 Feb 2025 | −18.59% | 182 days | – | – |
Scheme
Peak17 Dec 2024
Trough03 Mar 2025
Depth−27.91%
Fell over76 days
Recovered–
Recovery took–
Benchmark
Peak30 Aug 2024
Trough28 Feb 2025
Depth−18.59%
Fell over182 days
Recovered–
Recovery took–
The benchmark's peak, trough and recovery are read off its month-end curve; the scheme's row is measured on daily NAV. · Risk and drawdown use a trailing 3Y window · As on 31 Aug 2026
Portfolio Details : Where the money actually sits
Stocks
26
P/E ratio
55.82
P/B ratio
5.24
Dividend yield
0.21%
Avg market cap
₹80,716 Cr
Median market cap
₹53,705 Cr
Asset class
Equity
Market cap
Large cap26.48%
Mid cap35.36%
Small cap36.92%
Cash & others1.24%
As on 31 Jul 2026
Fees
A fixed plan is cheaper when returns are strong. A performance plan costs less in lean years and shares the upside only when the fund beats a hurdle.
 FixedPlan A · Simple
Fixed Management Fee2.50% / yr
Performance FeeNone
Hurdle RateNot applicable
 VariablePlan B · Performance Linked
Fixed Management FeeNone
Performance Fee20% of profit
Hurdle RateAbove 8%
Exit load 2.00% within 1 year, nil after 2 years. Lock-in: Nil.
Let's start a
conversation
conversation
- Compare this PMS against 3,000+ others with our research desk
- Build a long-term portfolio around your goals, not a one-off buy
- Experts with decades of experience.
Private. Personal. No obligation.
We will only use these details to contact you about this enquiry. No spam.