
PMS · Equity · Large Cap
Reliance - Alpha Large Cap
Fund size₹1 Cr
Alpha (3Y)−0.03%
3Y return21.82%
Fund age9 yrs 6 mo
Fund Managers
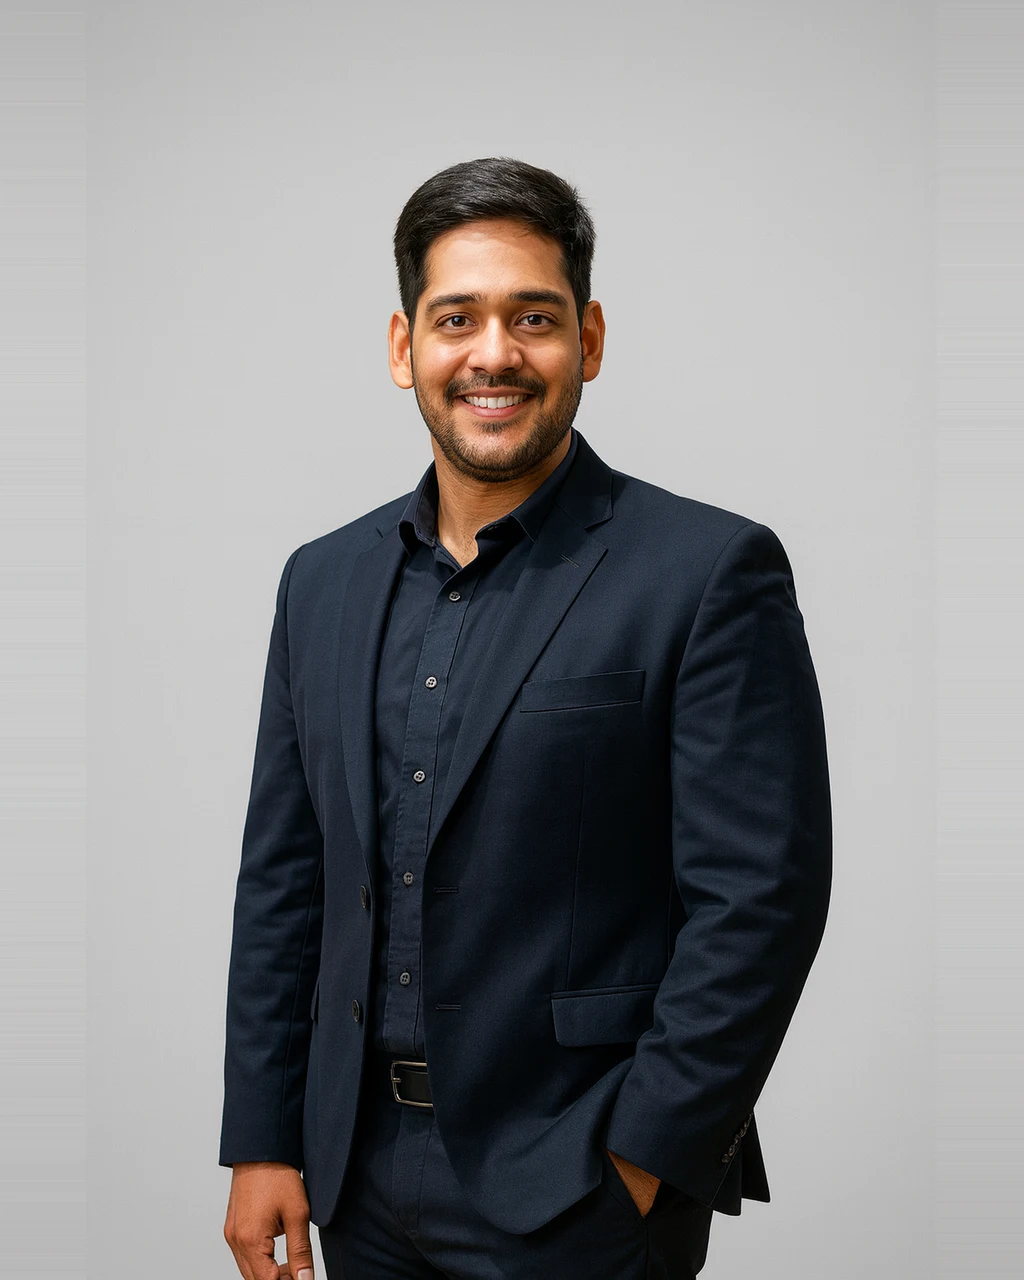
Vikas Rajpal
Fund Manager, Reliance Wealth
Vikas Rajpal has close to 9 years of experience in the Capital Markets on sell and buy side equities. Having joined Reliance Wealth PMS in March 2020; he has been actively involved in fund management. He has evaluated varied investment opportunities across sectors and geographies in previous roles at leading broking houses and investment funds. In his previous stint with Karvy PMS; he was actively involved in managing equity PMS and generated decent returns for the clients. He has extensively tracked Automobiles; BFSI; FMCG and Specialty Chemicals previously. He has done his BE in Chemical Engineering from Mumbai University and is currently pursuing Executive MBA from NMIMS University.
Managing AUM₹36 Cr

Mr. Varun Bang
Fund Manager, Reliance Wealth
Varun Bang has more than 8 years of experience in equity research and fund management. He completed his Post Graduation in Finance and joined Pramerica Mutual Fund (US Prudential Group) in 2013 as a research analyst where he primarily tracked Cement; Healthcare and Agrochemicals. Since late 2017; he has been associated with Reliance Wealth PMS and has been actively involved in fund management. His pedigree lies in identifying good businesses early in the cycle which have turned out to be multi-baggers for PMS portfolios.
Managing AUM₹36 Cr
Growth of₹Cr
Reliance Alpha Large Cap
Returns: How it has done
| Scheme / Benchmark | YTD | 1Y | 2Y | 3Y | 5Y | Since inception |
|---|---|---|---|---|---|---|
| Reliance Alpha Large Cap | — | 8.20% | 12.67% | 21.82% | 12.01% | 12.61% |
| Nifty 500 | −8.38% | 9.63% | 13.92% | 22.03% | 15.35% | 14.30% |
| Excess over benchmark | — | −1.43% | −1.25% | −0.21% | −3.34% | −1.69% |
Returns up to one year are absolute; two years and above are annualised (CAGR). YTD is calendar-year-to-date. As on 31 Oct 2023.
Risk : What you take on to earn the return
Volatility
15.00%
Benchmark approx 14.21%
A standard deviation reflecting historical swings.
Sensitivity
0.99
Beta vs benchmark 1.00 · 1% less reactive
How strongly the scheme moves with the index.
Risk-reward
0.93
Sharpe
Excess return gained per unit of volatility.
Capture ratio
94 / 86
Upside / Downside Capture
Share of market gains captured versus losses absorbed.
Portfolio Details : Where the money actually sits
Stocks
37
P/E ratio
26.77
P/B ratio
4.10
Dividend yield
0.40%
Avg market cap
₹2.56 L Cr
Median market cap
₹97,439 Cr
Asset class
Equity
Market cap
Large cap69.91%
Mid cap5.51%
Small cap22.85%
Cash & others1.73%
As on 31 Oct 2023
Fees
A fixed plan is cheaper when returns are strong. A performance plan costs less in lean years and shares the upside only when the fund beats a hurdle. Both cost the same at a 12.50% gross return.
 FixedPlan A · Simple
Fixed Management Fee2.00% / yr
Performance FeeNone
Hurdle RateNot applicable
 VariablePlan B · Shared upside
Fixed Management Fee1.50% / yr
Performance Fee20% of profit
Hurdle RateAbove 10%
Lock-in: Nil.
Let's start a
conversation
conversation
- Compare this PMS against 3,000+ others with our research desk
- Build a long-term portfolio around your goals, not a one-off buy
- Experts with decades of experience.
Private. Personal. No obligation.
We will only use these details to contact you about this enquiry. No spam.