
PMS · Equity · Mid & Small Cap
Roha Asset Managers - Emerging Champion
Fund size₹299 Cr
Alpha (3Y)−0.68%
3Y return11.45%
Fund age5 yrs 11 mo
Fund Managers
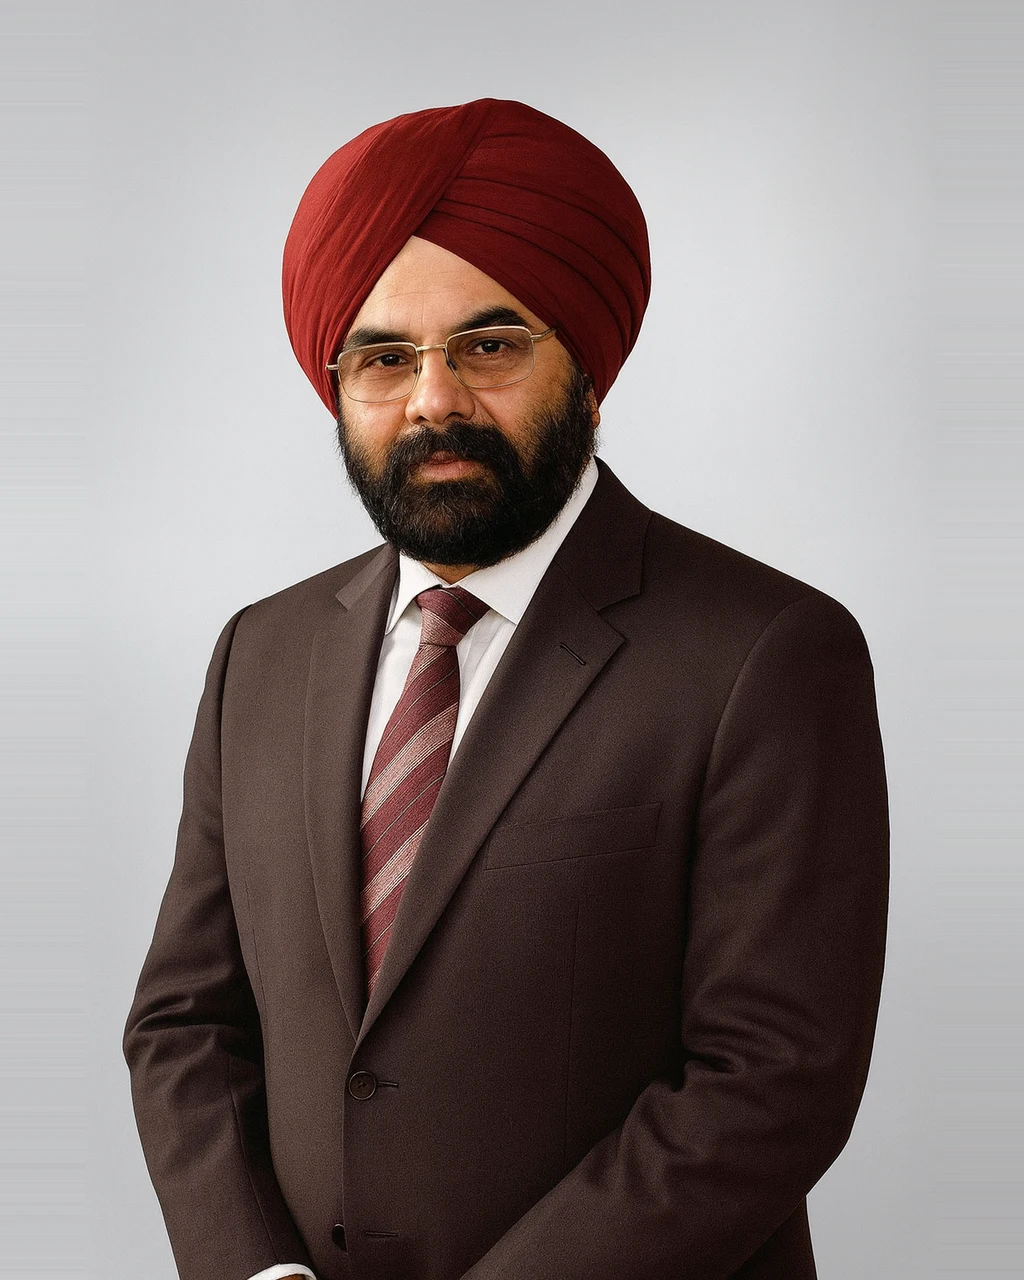
DALJEET SINGH KOHLI
Fund Manager, Roha
As the Head of Research and Strategy at Vasuki India Fund, I lead a team of talented analysts and strategists who cover the Indian equity market across various sectors and themes. I am responsible for setting the investment philosophy, strategy, and process for the fund, as well as conducting in-depth research and generating actionable recommendations. I am passionate about uncovering hidden gems and identifying emerging trends in the Indian market, and I leverage my extensive network and expertise to provide value-added insights and guidance to the fund's portfolio managers and investors.
Managing AUM₹309 Cr
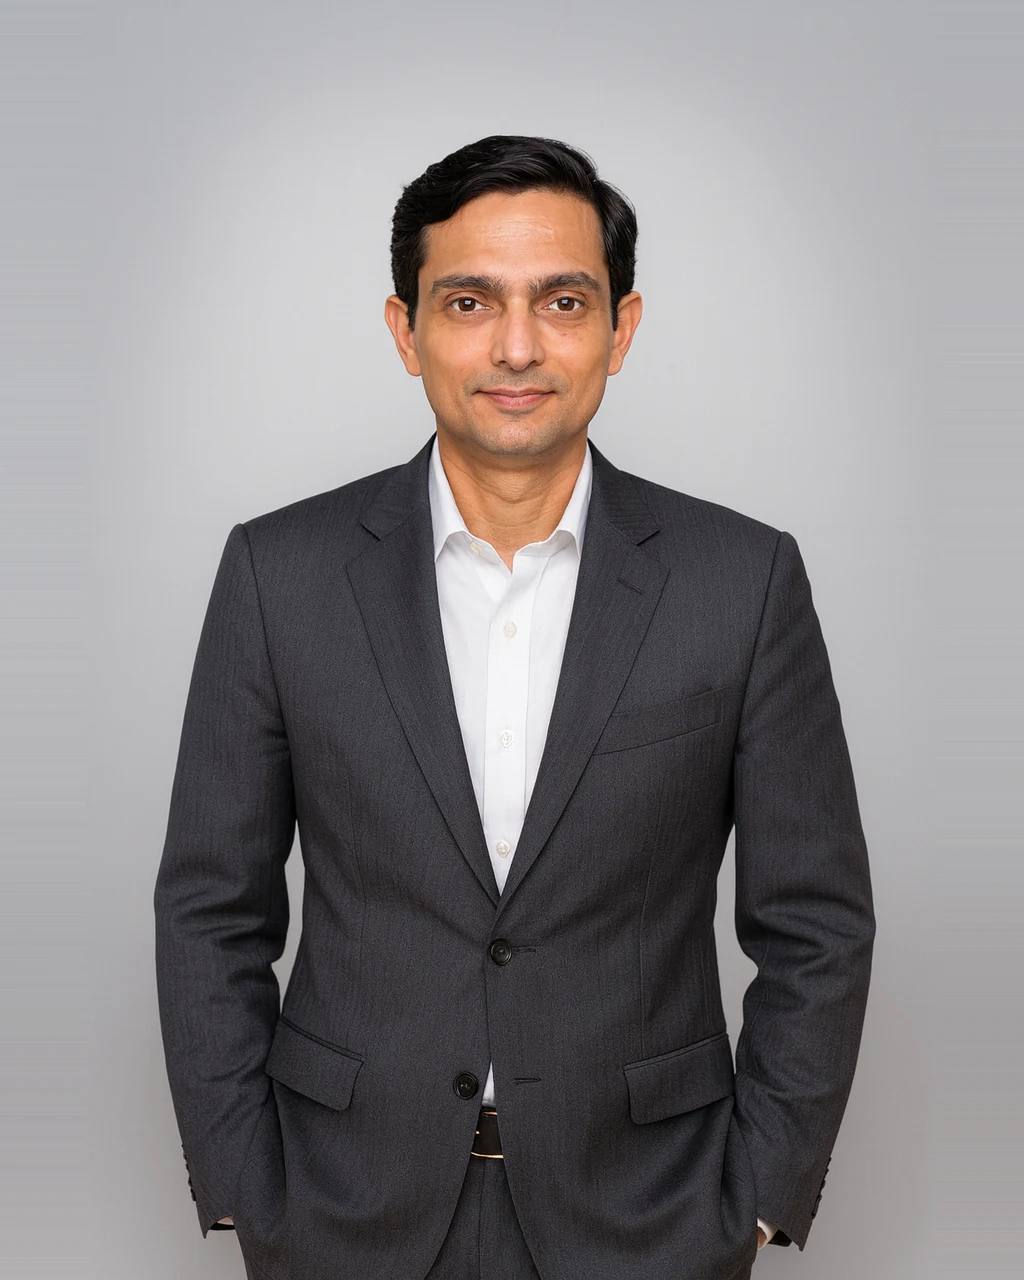
Rajdeep Virendra Singh
Principal Officer, Roha
Rajdeep Singh is an Investment Professional with over 17 years of experience in the Indian Capital markets. He holds an engineering degree and post-graduation Management degree with specialization in Finance from Mumbai University. Rajdeep has a strong equity research pedigree having worked with ASK Investment Managers for more than 14 years in equity research covering diverse sectors and has also managed portfolio more than Rs.800 Crs AUM under PMS schemes and a multi-cap focused Advisory strategy as Portfolio Manager. He has joined Roha Asset Managers LLP as Fund Manager and promoted to Principal Officer with effect from 17-02-2026. Rajdeep is part of Investment Strategy and Fund Management team for the listed equity PMS strategies at Roha Asset Managers LLP.
Managing AUM₹299 Cr
Returns: How it has done
| Scheme / Benchmark | YTD | 1Y | 2Y | 3Y | 5Y | Since inception |
|---|---|---|---|---|---|---|
| Roha Asset Managers Emerging Champion | — | 1.03% | −2.94% | 11.45% | 15.19% | 27.03% |
| Nifty 500 | −7.78% | 4.72% | −0.11% | 12.09% | 10.91% | 17.91% |
| Excess over benchmark | — | −3.69% | −2.83% | −0.64% | 4.28% | 9.12% |
Returns up to one year are absolute; two years and above are annualised (CAGR). YTD is calendar-year-to-date. As on 31 Aug 2026.
Risk : What you take on to earn the return
Volatility
23.40%
Benchmark approx 14.73%
A standard deviation reflecting historical swings.
Sensitivity
1.22
Beta vs benchmark 1.00 · 22% more reactive
How strongly the scheme moves with the index.
Risk-reward
0.35
Sharpe
Excess return gained per unit of volatility.
Capture ratio
113 / 118
Upside / Downside Capture
Share of market gains captured versus losses absorbed.
Portfolio Details : Where the money actually sits
Stocks
36
P/E ratio
23.57
P/B ratio
2.89
Dividend yield
0.58%
Avg market cap
₹15,509 Cr
Asset class
Equity
Market cap
Large cap2.33%
Mid cap2.33%
Small cap86.43%
Cash & others8.91%
As on 31 Aug 2026
Fees
A fixed plan is cheaper when returns are strong. A performance plan costs less in lean years and shares the upside only when the fund beats a hurdle. Both cost the same at a 15.00% gross return.
 FixedPlan A · Simple
Fixed Management Fee2.50% / yr
Performance FeeNone
Hurdle RateNot applicable
 VariablePlan B · Shared upside
Fixed Management Fee1.50% / yr
Performance Fee20% of profit
Hurdle RateAbove 10%
Exit load 1.00% within 1 year, nil after 2 years. Lock-in: Nil.
Let's start a
conversation
conversation
- Compare this PMS against 3,000+ others with our research desk
- Build a long-term portfolio around your goals, not a one-off buy
- Experts with decades of experience.
Private. Personal. No obligation.
We will only use these details to contact you about this enquiry. No spam.